Home · DDDallas Donners
9–4Final
GBAwayGood Better Best

Jan 27, 2026 · Central B - East vs South · American Airlines Center

MVP [CHA] Richard Tantrum · 8.7 performance rating

Writing the recap…

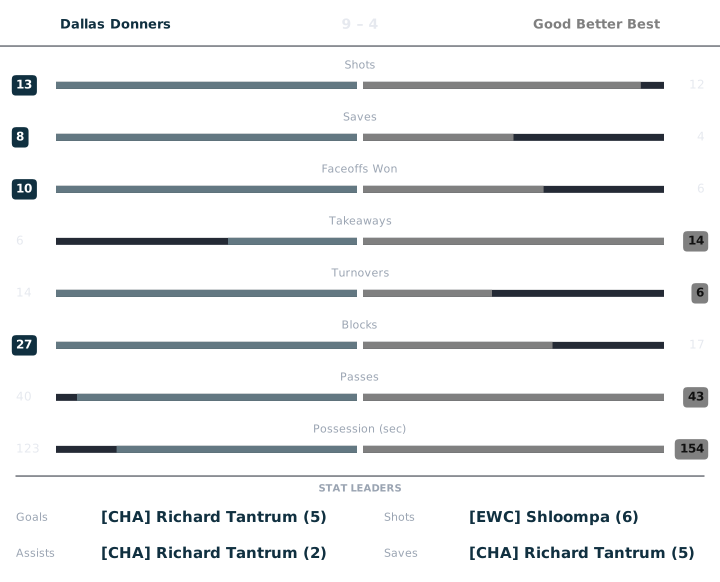
Match box score chart

Perf is a 0 to 10 Alto rating, 6.0 being league average. Click any Perf number to see the working behind it.

Dallas Donners

PlayerGAPtsShotsSavesFOWFOLTKTOBlkPassesGWGPossPerfPucker+OffDef
[CHA] Richard Tantrum527553044141211:371937.718.40
[EWC] Shloompa314621226101100:191027.726.42
[SEA] Mags🐻12321640431700:07678.334.65

Good Better Best

PlayerGAPtsShotsSavesFOWFOLTKTOBlkPassesGWGPossPerfPucker+OffDef
[GBB] Mumen Rider21331240241300:03717.864.03
[GBB] mattyb3012363138181501:541385.477.28
[GBB] mattyb6910130336351500:37673.655.31

Richard Tantrum Dallas Donners

rated once over the whole game. Baseline: the player's own division.

Performance8.7
StatValueLeague avgStd devWeightzContribution
Goals51.641.520.232.2070.508
Assists21.341.190.190.5560.106
Shots53.732.780.090.4560.041
Passes1216.097.240.08-0.564-0.045
Saves52.12.320.191.2520.238
Blocks146.144.080.111.9290.212
Takeaways43.072.820.110.3280.036

6.0 + clip(Σ 1.095 × 2, −3 to 3) = 8.191, then +0.3 blocks, +0.25 hot shooting → 8.7

Pucker+193
StatValueLeague rateRatioWeightContribution
Goal contribution72.8672.4420.320.781
Shots53.7341.3390.080.107
Saves52.0962.3860.150.358
Blocks146.1382.2810.070.16
Takeaways43.0741.3010.120.156
Passes1216.0850.7460.080.06
Faceoff win rate10.520.030.06

Σ 1.682 ÷ Σ weights 0.85 = 1.979 − 0.045 turnover penalty = 1.934 → ×100 = 193.34 → 193

Offensive7.71
RateValueLeagueWeightContribution
Points per possession-sec0.0720.0820.42.202
Shooting %10.4390.21.885
Assists per pass0.1670.0830.43.619

Σ contribution = 7.706

Defensive8.40
StatValueLeague rated(ratio)WeightContribution
Saves52.0969.5290.32.859
Blocks146.1389.4270.21.885
Takeaways43.0747.1690.251.792
Goals conceded45.5327.4610.251.865

Σ contribution = 8.401

League average is 6.0 on Performance, Offensive and Defensive, and 100 on Pucker+. Every formula.

Shloompa Dallas Donners

rated once over the whole game. Baseline: the player's own division.

Performance6.1
StatValueLeague avgStd devWeightzContribution
Goals31.641.520.230.8940.206
Assists11.341.190.19-0.287-0.054
Shots63.732.780.090.8160.073
Passes1116.097.240.08-0.702-0.056
Saves22.12.320.19-0.041-0.008
Blocks106.144.080.110.9470.104
Takeaways23.072.820.11-0.381-0.042

6.0 + clip(Σ 0.223 × 2, −3 to 3) = 6.446, then −0.3 turnovers → 6.1

Pucker+102
StatValueLeague rateRatioWeightContribution
Goal contribution42.8671.3950.320.446
Shots63.7341.6070.080.129
Saves22.0960.9540.150.143
Blocks106.1381.6290.070.114
Takeaways23.0740.6510.120.078
Passes1116.0850.6840.080.055
Faceoff win rate0.3330.50.6670.030.02

Σ 0.985 ÷ Σ weights 0.85 = 1.159 − 0.143 turnover penalty = 1.016 → ×100 = 101.6 → 102

Offensive7.72
RateValueLeagueWeightContribution
Points per possession-sec0.2110.0820.43.863
Shooting %0.50.4390.21.311
Assists per pass0.0910.0830.42.545

Σ contribution = 7.719

Defensive6.42
StatValueLeague rated(ratio)WeightContribution
Saves22.0965.8170.31.745
Blocks106.1388.230.21.646
Takeaways23.0744.6560.251.164
Goals conceded45.5327.4610.251.865

Σ contribution = 6.42

League average is 6.0 on Performance, Offensive and Defensive, and 100 on Pucker+. Every formula.

Mags🐻 Dallas Donners

rated once over the whole game. Baseline: the player's own division.

Performance5.3
StatValueLeague avgStd devWeightzContribution
Goals11.641.520.23-0.419-0.096
Assists21.341.190.190.5560.106
Shots23.732.780.09-0.625-0.056
Passes1716.097.240.080.1260.01
Saves12.12.320.19-0.473-0.09
Blocks36.144.080.11-0.77-0.085
Takeaways03.072.820.11-1.091-0.12

6.0 + clip(Σ −0.331 × 2, −3 to 3) = 5.337, nothing hit the bonus or penalty thresholds → 5.3

Pucker+67
StatValueLeague rateRatioWeightContribution
Goal contribution32.8671.0460.320.335
Shots23.7340.5360.080.043
Saves12.0960.4770.150.072
Blocks36.1380.4890.070.034
Takeaways03.07400.120
Passes1716.0851.0570.080.085
Faceoff win rate0.60.51.20.030.036

Σ 0.604 ÷ Σ weights 0.85 = 0.711 − 0.045 turnover penalty = 0.666 → ×100 = 66.55 → 67

Offensive8.33
RateValueLeagueWeightContribution
Points per possession-sec0.4290.0820.43.999
Shooting %0.50.4390.21.311
Assists per pass0.1180.0830.43.024

Σ contribution = 8.334

Defensive4.65
StatValueLeague rated(ratio)WeightContribution
Saves12.0964.080.31.224
Blocks36.1384.1160.20.823
Takeaways03.0742.9540.250.738
Goals conceded45.5327.4610.251.865

Σ contribution = 4.65

League average is 6.0 on Performance, Offensive and Defensive, and 100 on Pucker+. Every formula.

Mumen Rider Good Better Best

rated once over the whole game. Baseline: the player's own division.

Performance5.4
StatValueLeague avgStd devWeightzContribution
Goals21.641.520.230.2380.055
Assists11.341.190.19-0.287-0.054
Shots33.732.780.09-0.264-0.024
Passes1316.097.240.08-0.426-0.034
Saves12.12.320.19-0.473-0.09
Blocks46.144.080.11-0.525-0.058
Takeaways03.072.820.11-1.091-0.12

6.0 + clip(Σ −0.325 × 2, −3 to 3) = 5.35, then +0.25 hot shooting, −0.2 goals against → 5.4

Pucker+71
StatValueLeague rateRatioWeightContribution
Goal contribution32.8671.0460.320.335
Shots33.7340.8030.080.064
Saves12.0960.4770.150.072
Blocks46.1380.6520.070.046
Takeaways03.07400.120
Passes1316.0850.8080.080.065
Faceoff win rate0.3330.50.6670.030.02

Σ 0.601 ÷ Σ weights 0.85 = 0.707 → ×100 = 70.7 → 71

Offensive7.86
RateValueLeagueWeightContribution
Points per possession-sec10.0820.44
Shooting %0.6670.4390.21.582
Assists per pass0.0770.0830.42.277

Σ contribution = 7.859

Defensive4.03
StatValueLeague rated(ratio)WeightContribution
Saves12.0964.080.31.224
Blocks46.1384.660.20.932
Takeaways03.0742.9540.250.738
Goals conceded95.5324.5310.251.133

Σ contribution = 4.027

League average is 6.0 on Performance, Offensive and Defensive, and 100 on Pucker+. Every formula.

mattyb30 Good Better Best

rated once over the whole game. Baseline: the player's own division.

Performance6.4
StatValueLeague avgStd devWeightzContribution
Goals11.641.520.23-0.419-0.096
Assists21.341.190.190.5560.106
Shots63.732.780.090.8160.073
Passes1516.097.240.08-0.15-0.012
Saves32.12.320.190.390.074
Blocks86.144.080.110.4570.05
Takeaways83.072.820.111.7480.192

6.0 + clip(Σ 0.387 × 2, −3 to 3) = 6.774, then −0.2 cold shooting, −0.2 goals against → 6.4

Pucker+138
StatValueLeague rateRatioWeightContribution
Goal contribution32.8671.0460.320.335
Shots63.7341.6070.080.129
Saves32.0961.4310.150.215
Blocks86.1381.3030.070.091
Takeaways83.0742.6020.120.312
Passes1516.0850.9330.080.075
Faceoff win rate0.250.50.50.030.015

Σ 1.171 ÷ Σ weights 0.85 = 1.378 → ×100 = 137.79 → 138

Offensive5.47
RateValueLeagueWeightContribution
Points per possession-sec0.0260.0820.41.453
Shooting %0.1670.4390.20.759
Assists per pass0.1330.0830.43.259

Σ contribution = 5.471

Defensive7.28
StatValueLeague rated(ratio)WeightContribution
Saves32.0967.6260.32.288
Blocks86.1387.1770.21.435
Takeaways83.0749.6880.252.422
Goals conceded95.5324.5310.251.133

Σ contribution = 7.278

League average is 6.0 on Performance, Offensive and Defensive, and 100 on Pucker+. Every formula.

mattyb69 Good Better Best

rated once over the whole game. Baseline: the player's own division.

Performance4.7
StatValueLeague avgStd devWeightzContribution
Goals11.641.520.23-0.419-0.096
Assists01.341.190.19-1.129-0.214
Shots33.732.780.09-0.264-0.024
Passes1516.097.240.08-0.15-0.012
Saves02.12.320.19-0.904-0.172
Blocks56.144.080.11-0.279-0.031
Takeaways63.072.820.111.0380.114

6.0 + clip(Σ −0.435 × 2, −3 to 3) = 5.13, then −0.2 cold shooting, −0.2 goals against → 4.7

Pucker+67
StatValueLeague rateRatioWeightContribution
Goal contribution12.8670.3490.320.112
Shots33.7340.8030.080.064
Saves02.09600.150
Blocks56.1380.8150.070.057
Takeaways63.0741.9520.120.234
Passes1516.0850.9330.080.075
Faceoff win rate0.50.510.030.03

Σ 0.572 ÷ Σ weights 0.85 = 0.673 → ×100 = 67.26 → 67

Offensive3.65
RateValueLeagueWeightContribution
Points per possession-sec0.0270.0820.41.462
Shooting %0.3330.4390.21.011
Assists per pass00.0830.41.181

Σ contribution = 3.655

Defensive5.31
StatValueLeague rated(ratio)WeightContribution
Saves02.0962.9540.30.886
Blocks56.1385.2670.21.053
Takeaways63.0748.9620.252.24
Goals conceded95.5324.5310.251.133

Σ contribution = 5.312

League average is 6.0 on Performance, Offensive and Defensive, and 100 on Pucker+. Every formula.