AAHomeAvalon Avalanche
8–9Final
OVAwayOttawa Valley Island Boys

Jan 24, 2025 · Central B · Avalanche Heights Iceplex

MVP [CHA] Tridoxity · 8.3 performance rating

Writing the recap…

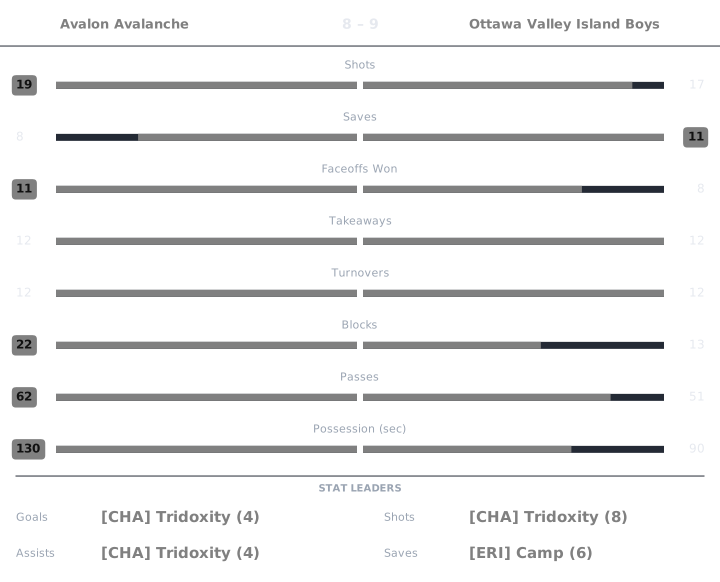
Match box score chart

Perf is a 0 to 10 Alto rating, 6.0 being league average. Click any Perf number to see the working behind it.

Avalon Avalanche

PlayerGAPtsShotsSavesFOWFOLTKTOBlkPassesGWGPossPerfPucker+OffDef
[AVAL] coolin21372123241600:19985.835.41
[BBB] Beefus0110311132800:10535.715.21
[CHA] Tridoxity448836285112601:341926.517.74
[OVFS] PEETAH22440330251200:07668.583.95

Ottawa Valley Island Boys

PlayerGAPtsShotsSavesFOWFOLTKTOBlkPassesGWGPossPerfPucker+OffDef
[ERI] Camp2134611275800:261026.566.50
[OVPS] BroBurgota0111301415700:20685.296.48
[OVPS] EggsThink31442432111800:21966.774.90
[QUE] Nayr[QC]22430250311000:09619.113.60
[TRI] AboveAverageJoe2025011401810:14615.144.60

coolin Avalon Avalanche

rated once over the whole game. Baseline: the player's own division.

Performance5.5
StatValueLeague avgStd devWeightzContribution
Goals21.931.730.230.0430.01
Assists11.581.410.19-0.412-0.078
Shots73.932.860.091.0750.097
Passes1616.116.640.08-0.016-0.001
Saves22.022.210.19-0.011-0.002
Blocks45.824.350.11-0.418-0.046
Takeaways33.233.180.11-0.072-0.008

6.0 + clip(Σ −0.029 × 2, −3 to 3) = 5.942, then −0.2 cold shooting, −0.2 goals against → 5.5

Pucker+98
StatValueLeague rateRatioWeightContribution
Goal contribution33.3750.8890.320.284
Shots73.9261.7830.080.143
Saves22.0230.9880.150.148
Blocks45.8170.6880.070.048
Takeaways33.230.9290.120.111
Passes1616.1090.9930.080.079
Faceoff win rate0.3330.50.6670.030.02

Σ 0.834 ÷ Σ weights 0.85 = 0.982 → ×100 = 98.16 → 98

Offensive5.83
RateValueLeagueWeightContribution
Points per possession-sec0.1580.1070.43.101
Shooting %0.2860.4910.20.884
Assists per pass0.0620.0980.41.844

Σ contribution = 5.829

Defensive5.41
StatValueLeague rated(ratio)WeightContribution
Saves22.0235.9540.31.786
Blocks45.8174.790.20.958
Takeaways33.235.7160.251.429
Goals conceded96.5564.940.251.235

Σ contribution = 5.408

League average is 6.0 on Performance, Offensive and Defensive, and 100 on Pucker+. Every formula.

Beefus Avalon Avalanche

rated once over the whole game. Baseline: the player's own division.

Performance4.5
StatValueLeague avgStd devWeightzContribution
Goals01.931.730.23-1.112-0.256
Assists11.581.410.19-0.412-0.078
Shots03.932.860.09-1.373-0.124
Passes816.116.640.08-1.222-0.098
Saves32.022.210.190.4410.084
Blocks25.824.350.11-0.877-0.097
Takeaways13.233.180.11-0.7-0.077

6.0 + clip(Σ −0.645 × 2, −3 to 3) = 4.71, then −0.2 goals against → 4.5

Pucker+53
StatValueLeague rateRatioWeightContribution
Goal contribution13.3750.2960.320.095
Shots03.92600.080
Saves32.0231.4830.150.222
Blocks25.8170.3440.070.024
Takeaways13.230.310.120.037
Passes816.1090.4970.080.04
Faceoff win rate0.50.510.030.03

Σ 0.448 ÷ Σ weights 0.85 = 0.527 → ×100 = 52.72 → 53

Offensive5.71
RateValueLeagueWeightContribution
Points per possession-sec0.10.1070.42.289
Shooting %00.4910.20.591
Assists per pass0.1250.0980.42.829

Σ contribution = 5.709

Defensive5.21
StatValueLeague rated(ratio)WeightContribution
Saves32.0237.7940.32.338
Blocks25.8173.6970.20.739
Takeaways13.233.6070.250.902
Goals conceded96.5564.940.251.235

Σ contribution = 5.214

League average is 6.0 on Performance, Offensive and Defensive, and 100 on Pucker+. Every formula.

Tridoxity Avalon Avalanche

rated once over the whole game. Baseline: the player's own division.

Performance8.3
StatValueLeague avgStd devWeightzContribution
Goals41.931.730.231.1980.275
Assists41.581.410.191.720.327
Shots83.932.860.091.4250.128
Passes2616.116.640.081.490.119
Saves32.022.210.190.4410.084
Blocks115.824.350.111.1910.131
Takeaways83.233.180.111.4980.165

6.0 + clip(Σ 1.23 × 2, −3 to 3) = 8.459, then −0.2 goals against → 8.3

Pucker+192
StatValueLeague rateRatioWeightContribution
Goal contribution7.53.3752.2220.320.711
Shots83.9262.0380.080.163
Saves32.0231.4830.150.222
Blocks115.8171.8910.070.132
Takeaways83.232.4770.120.297
Passes2616.1091.6140.080.129
Faceoff win rate0.750.51.50.030.045

Σ 1.7 ÷ Σ weights 0.85 = 2 − 0.081 turnover penalty = 1.919 → ×100 = 191.94 → 192

Offensive6.51
RateValueLeagueWeightContribution
Points per possession-sec0.0850.1070.42.072
Shooting %0.50.4910.21.215
Assists per pass0.1540.0980.43.223

Σ contribution = 6.511

Defensive7.74
StatValueLeague rated(ratio)WeightContribution
Saves32.0237.7940.32.338
Blocks115.8178.8470.21.769
Takeaways83.239.6040.252.401
Goals conceded96.5564.940.251.235

Σ contribution = 7.743

League average is 6.0 on Performance, Offensive and Defensive, and 100 on Pucker+. Every formula.

PEETAH Avalon Avalanche

rated once over the whole game. Baseline: the player's own division.

Performance5.2
StatValueLeague avgStd devWeightzContribution
Goals21.931.730.230.0430.01
Assists21.581.410.190.2990.057
Shots43.932.860.090.0260.002
Passes1216.116.640.08-0.619-0.05
Saves02.022.210.19-0.914-0.174
Blocks55.824.350.11-0.188-0.021
Takeaways03.233.180.11-1.014-0.112

6.0 + clip(Σ −0.287 × 2, −3 to 3) = 5.427, then −0.2 goals against → 5.2

Pucker+66
StatValueLeague rateRatioWeightContribution
Goal contribution3.53.3751.0370.320.332
Shots43.9261.0190.080.082
Saves02.02300.150
Blocks55.8170.860.070.06
Takeaways03.2300.120
Passes1216.1090.7450.080.06
Faceoff win rate0.50.510.030.03

Σ 0.563 ÷ Σ weights 0.85 = 0.662 → ×100 = 66.24 → 66

Offensive8.58
RateValueLeagueWeightContribution
Points per possession-sec0.5710.1070.43.999
Shooting %0.50.4910.21.215
Assists per pass0.1670.0980.43.366

Σ contribution = 8.581

Defensive3.95
StatValueLeague rated(ratio)WeightContribution
Saves02.0232.9540.30.886
Blocks55.8175.4420.21.088
Takeaways03.232.9540.250.738
Goals conceded96.5564.940.251.235

Σ contribution = 3.947

League average is 6.0 on Performance, Offensive and Defensive, and 100 on Pucker+. Every formula.

Camp Ottawa Valley Island Boys

rated once over the whole game. Baseline: the player's own division.

Performance5.7
StatValueLeague avgStd devWeightzContribution
Goals21.931.730.230.0430.01
Assists11.581.410.19-0.412-0.078
Shots43.932.860.090.0260.002
Passes816.116.640.08-1.222-0.098
Saves62.022.210.191.7970.341
Blocks55.824.350.11-0.188-0.021
Takeaways23.233.180.11-0.386-0.042

6.0 + clip(Σ 0.114 × 2, −3 to 3) = 6.229, then −0.3 turnovers, −0.2 goals against → 5.7

Pucker+102
StatValueLeague rateRatioWeightContribution
Goal contribution33.3750.8890.320.284
Shots43.9261.0190.080.082
Saves62.0232.9650.150.445
Blocks55.8170.860.070.06
Takeaways23.230.6190.120.074
Passes816.1090.4970.080.04
Faceoff win rate0.50.510.030.03

Σ 1.015 ÷ Σ weights 0.85 = 1.194 − 0.173 turnover penalty = 1.021 → ×100 = 102.09 → 102

Offensive6.56
RateValueLeagueWeightContribution
Points per possession-sec0.1150.1070.42.518
Shooting %0.50.4910.21.215
Assists per pass0.1250.0980.42.829

Σ contribution = 6.562

Defensive6.50
StatValueLeague rated(ratio)WeightContribution
Saves62.0239.8460.32.954
Blocks55.8175.4420.21.088
Takeaways23.234.5470.251.137
Goals conceded86.5565.2860.251.321

Σ contribution = 6.5

League average is 6.0 on Performance, Offensive and Defensive, and 100 on Pucker+. Every formula.

BroBurgota Ottawa Valley Island Boys

rated once over the whole game. Baseline: the player's own division.

Performance4.7
StatValueLeague avgStd devWeightzContribution
Goals01.931.730.23-1.112-0.256
Assists11.581.410.19-0.412-0.078
Shots13.932.860.09-1.023-0.092
Passes716.116.640.08-1.373-0.11
Saves32.022.210.190.4410.084
Blocks55.824.350.11-0.188-0.021
Takeaways43.233.180.110.2420.027

6.0 + clip(Σ −0.446 × 2, −3 to 3) = 5.108, then −0.2 cold shooting, −0.2 goals against → 4.7

Pucker+68
StatValueLeague rateRatioWeightContribution
Goal contribution13.3750.2960.320.095
Shots13.9260.2550.080.02
Saves32.0231.4830.150.222
Blocks55.8170.860.070.06
Takeaways43.231.2390.120.149
Passes716.1090.4350.080.035
Faceoff win rate00.500.030

Σ 0.581 ÷ Σ weights 0.85 = 0.684 → ×100 = 68.37 → 68

Offensive5.29
RateValueLeagueWeightContribution
Points per possession-sec0.050.1070.41.618
Shooting %00.4910.20.591
Assists per pass0.1430.0980.43.084

Σ contribution = 5.292

Defensive6.48
StatValueLeague rated(ratio)WeightContribution
Saves32.0237.7940.32.338
Blocks55.8175.4420.21.088
Takeaways43.236.9370.251.734
Goals conceded86.5565.2860.251.321

Σ contribution = 6.481

League average is 6.0 on Performance, Offensive and Defensive, and 100 on Pucker+. Every formula.

EggsThink Ottawa Valley Island Boys

rated once over the whole game. Baseline: the player's own division.

Performance5.9
StatValueLeague avgStd devWeightzContribution
Goals31.931.730.230.620.143
Assists11.581.410.19-0.412-0.078
Shots43.932.860.090.0260.002
Passes1816.116.640.080.2850.023
Saves22.022.210.19-0.011-0.002
Blocks15.824.350.11-1.107-0.122
Takeaways23.233.180.11-0.386-0.042

6.0 + clip(Σ −0.077 × 2, −3 to 3) = 5.846, then +0.25 hot shooting, −0.2 goals against → 5.9

Pucker+96
StatValueLeague rateRatioWeightContribution
Goal contribution43.3751.1850.320.379
Shots43.9261.0190.080.082
Saves22.0230.9880.150.148
Blocks15.8170.1720.070.012
Takeaways23.230.6190.120.074
Passes1816.1091.1170.080.089
Faceoff win rate0.5710.51.1430.030.034

Σ 0.819 ÷ Σ weights 0.85 = 0.964 → ×100 = 96.35 → 96

Offensive6.77
RateValueLeagueWeightContribution
Points per possession-sec0.190.1070.43.438
Shooting %0.750.4910.21.588
Assists per pass0.0560.0980.41.747

Σ contribution = 6.772

Defensive4.90
StatValueLeague rated(ratio)WeightContribution
Saves22.0235.9540.31.786
Blocks15.8173.2820.20.656
Takeaways23.234.5470.251.137
Goals conceded86.5565.2860.251.321

Σ contribution = 4.9

League average is 6.0 on Performance, Offensive and Defensive, and 100 on Pucker+. Every formula.

Nayr[QC] Ottawa Valley Island Boys

rated once over the whole game. Baseline: the player's own division.

Performance5.2
StatValueLeague avgStd devWeightzContribution
Goals21.931.730.230.0430.01
Assists21.581.410.190.2990.057
Shots33.932.860.09-0.324-0.029
Passes1016.116.640.08-0.921-0.074
Saves02.022.210.19-0.914-0.174
Blocks15.824.350.11-1.107-0.122
Takeaways03.233.180.11-1.014-0.112

6.0 + clip(Σ −0.443 × 2, −3 to 3) = 5.113, then +0.25 hot shooting, −0.2 goals against → 5.2

Pucker+61
StatValueLeague rateRatioWeightContribution
Goal contribution43.3751.1850.320.379
Shots33.9260.7640.080.061
Saves02.02300.150
Blocks15.8170.1720.070.012
Takeaways03.2300.120
Passes1016.1090.6210.080.05
Faceoff win rate0.2860.50.5710.030.017

Σ 0.519 ÷ Σ weights 0.85 = 0.611 → ×100 = 61.08 → 61

Offensive9.11
RateValueLeagueWeightContribution
Points per possession-sec0.4440.1070.43.994
Shooting %0.6670.4910.21.475
Assists per pass0.20.0980.43.644

Σ contribution = 9.114

Defensive3.60
StatValueLeague rated(ratio)WeightContribution
Saves02.0232.9540.30.886
Blocks15.8173.2820.20.656
Takeaways03.232.9540.250.738
Goals conceded86.5565.2860.251.321

Σ contribution = 3.601

League average is 6.0 on Performance, Offensive and Defensive, and 100 on Pucker+. Every formula.

AboveAverageJoe Ottawa Valley Island Boys

rated once over the whole game. Baseline: the player's own division.

Performance4.5
StatValueLeague avgStd devWeightzContribution
Goals21.931.730.230.0430.01
Assists01.581.410.19-1.123-0.213
Shots53.932.860.090.3760.034
Passes816.116.640.08-1.222-0.098
Saves02.022.210.19-0.914-0.174
Blocks15.824.350.11-1.107-0.122
Takeaways43.233.180.110.2420.027

6.0 + clip(Σ −0.536 × 2, −3 to 3) = 4.927, then −0.2 cold shooting, −0.2 goals against → 4.5

Pucker+61
StatValueLeague rateRatioWeightContribution
Goal contribution23.3750.5930.320.19
Shots53.9261.2740.080.102
Saves02.02300.150
Blocks15.8170.1720.070.012
Takeaways43.231.2390.120.149
Passes816.1090.4970.080.04
Faceoff win rate0.50.510.030.03

Σ 0.522 ÷ Σ weights 0.85 = 0.614 → ×100 = 61.4 → 61

Offensive5.14
RateValueLeagueWeightContribution
Points per possession-sec0.1430.1070.42.909
Shooting %0.40.4910.21.054
Assists per pass00.0980.41.181

Σ contribution = 5.144

Defensive4.60
StatValueLeague rated(ratio)WeightContribution
Saves02.0232.9540.30.886
Blocks15.8173.2820.20.656
Takeaways43.236.9370.251.734
Goals conceded86.5565.2860.251.321

Σ contribution = 4.597

League average is 6.0 on Performance, Offensive and Defensive, and 100 on Pucker+. Every formula.