BCHomeBrampton Cows
3–13Final
OVAwayOttawa Valley Island Boys

Feb 5, 2025 · Central B · The Big Barn

MVP [OVPS] BroBurgota · 7.9 performance rating

Writing the recap…

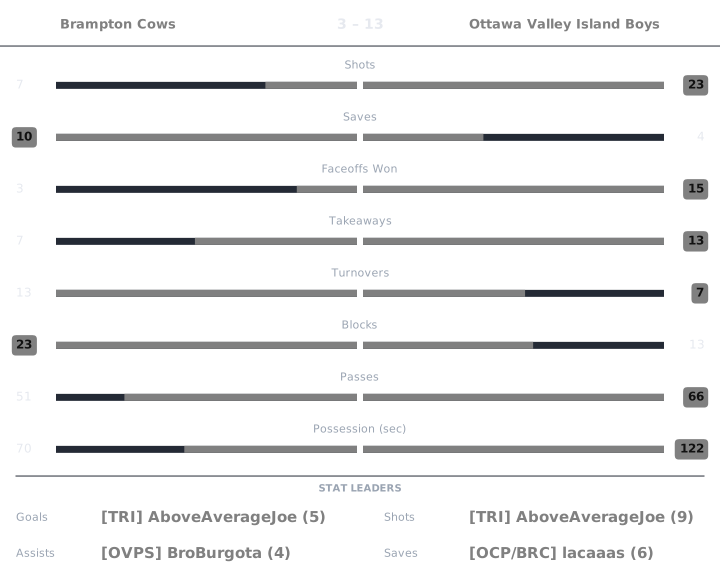
Match box score chart

Perf is a 0 to 10 Alto rating, 6.0 being league average. Click any Perf number to see the working behind it.

Brampton Cows

PlayerGAPtsShotsSavesFOWFOLTKTOBlkPassesGWGPossPerfPucker+OffDef
[BRC] Fizzy00022071962400:20232.954.95
[ELK] Kavorka20222031271100:12656.215.09
[OCP/BRC] lacaaas112363552101600:381304.447.69

Ottawa Valley Island Boys

PlayerGAPtsShotsSavesFOWFOLTKTOBlkPassesGWGPossPerfPucker+OffDef
[OVPS] BroBurgota44873317342201:071877.427.88
[OVPS] EggsThink43770821152100:181248.405.14
[TRI] AboveAverageJoe52791405342300:371566.956.46

Fizzy Brampton Cows

rated once over the whole game. Baseline: the player's own division.

Performance4.3
StatValueLeague avgStd devWeightzContribution
Goals01.931.730.23-1.112-0.256
Assists01.581.410.19-1.123-0.213
Shots23.932.860.09-0.674-0.061
Passes2416.116.640.081.1890.095
Saves22.022.210.19-0.011-0.002
Blocks65.824.350.110.0420.005
Takeaways13.233.180.11-0.7-0.077

6.0 + clip(Σ −0.509 × 2, −3 to 3) = 4.982, then −0.3 turnovers, −0.2 cold shooting, −0.2 goals against → 4.3

Pucker+23
StatValueLeague rateRatioWeightContribution
Goal contribution03.37500.320
Shots23.9260.5090.080.041
Saves22.0230.9880.150.148
Blocks65.8171.0310.070.072
Takeaways13.230.310.120.037
Passes2416.1091.490.080.119
Faceoff win rate00.500.030

Σ 0.418 ÷ Σ weights 0.85 = 0.491 − 0.266 turnover penalty = 0.225 → ×100 = 22.57 → 23

Offensive2.95
RateValueLeagueWeightContribution
Points per possession-sec00.1070.41.181
Shooting %00.4910.20.591
Assists per pass00.0980.41.181

Σ contribution = 2.954

Defensive4.95
StatValueLeague rated(ratio)WeightContribution
Saves22.0235.9540.31.786
Blocks65.8176.1260.21.225
Takeaways13.233.6070.250.902
Goals conceded136.5564.1650.251.041

Σ contribution = 4.954

League average is 6.0 on Performance, Offensive and Defensive, and 100 on Pucker+. Every formula.

Kavorka Brampton Cows

rated once over the whole game. Baseline: the player's own division.

Performance5.3
StatValueLeague avgStd devWeightzContribution
Goals21.931.730.230.0430.01
Assists01.581.410.19-1.123-0.213
Shots23.932.860.09-0.674-0.061
Passes1116.116.640.08-0.77-0.062
Saves22.022.210.19-0.011-0.002
Blocks75.824.350.110.2720.03
Takeaways13.233.180.11-0.7-0.077

6.0 + clip(Σ −0.375 × 2, −3 to 3) = 5.25, then +0.25 hot shooting, −0.2 goals against → 5.3

Pucker+65
StatValueLeague rateRatioWeightContribution
Goal contribution23.3750.5930.320.19
Shots23.9260.5090.080.041
Saves22.0230.9880.150.148
Blocks75.8171.2030.070.084
Takeaways13.230.310.120.037
Passes1116.1090.6830.080.055
Faceoff win rate00.500.030

Σ 0.555 ÷ Σ weights 0.85 = 0.653 → ×100 = 65.25 → 65

Offensive6.21
RateValueLeagueWeightContribution
Points per possession-sec0.1670.1070.43.202
Shooting %10.4910.21.822
Assists per pass00.0980.41.181

Σ contribution = 6.206

Defensive5.09
StatValueLeague rated(ratio)WeightContribution
Saves22.0235.9540.31.786
Blocks75.8176.8020.21.36
Takeaways13.233.6070.250.902
Goals conceded136.5564.1650.251.041

Σ contribution = 5.089

League average is 6.0 on Performance, Offensive and Defensive, and 100 on Pucker+. Every formula.

lacaaas Brampton Cows

rated once over the whole game. Baseline: the player's own division.

Performance6.2
StatValueLeague avgStd devWeightzContribution
Goals11.931.730.23-0.535-0.123
Assists11.581.410.19-0.412-0.078
Shots33.932.860.09-0.324-0.029
Passes1616.116.640.08-0.016-0.001
Saves62.022.210.191.7970.341
Blocks105.824.350.110.9620.106
Takeaways53.233.180.110.5560.061

6.0 + clip(Σ 0.277 × 2, −3 to 3) = 6.553, then −0.2 cold shooting, −0.2 goals against → 6.2

Pucker+130
StatValueLeague rateRatioWeightContribution
Goal contribution23.3750.5930.320.19
Shots33.9260.7640.080.061
Saves62.0232.9650.150.445
Blocks105.8171.7190.070.12
Takeaways53.231.5480.120.186
Passes1616.1090.9930.080.079
Faceoff win rate0.3750.50.750.030.022

Σ 1.104 ÷ Σ weights 0.85 = 1.298 → ×100 = 129.84 → 130

Offensive4.44
RateValueLeagueWeightContribution
Points per possession-sec0.0530.1070.41.648
Shooting %0.3330.4910.20.952
Assists per pass0.0620.0980.41.844

Σ contribution = 4.444

Defensive7.69
StatValueLeague rated(ratio)WeightContribution
Saves62.0239.8460.32.954
Blocks105.8178.4650.21.693
Takeaways53.237.9970.251.999
Goals conceded136.5564.1650.251.041

Σ contribution = 7.687

League average is 6.0 on Performance, Offensive and Defensive, and 100 on Pucker+. Every formula.

BroBurgota Ottawa Valley Island Boys

rated once over the whole game. Baseline: the player's own division.

Performance7.9
StatValueLeague avgStd devWeightzContribution
Goals41.931.730.231.1980.275
Assists41.581.410.191.720.327
Shots73.932.860.091.0750.097
Passes2216.116.640.080.8880.071
Saves32.022.210.190.4410.084
Blocks45.824.350.11-0.418-0.046
Takeaways73.233.180.111.1840.13

6.0 + clip(Σ 0.938 × 2, −3 to 3) = 7.877, nothing hit the bonus or penalty thresholds → 7.9

Pucker+187
StatValueLeague rateRatioWeightContribution
Goal contribution83.3752.370.320.758
Shots73.9261.7830.080.143
Saves32.0231.4830.150.222
Blocks45.8170.6880.070.048
Takeaways73.232.1670.120.26
Passes2216.1091.3660.080.109
Faceoff win rate0.750.51.50.030.045

Σ 1.586 ÷ Σ weights 0.85 = 1.866 → ×100 = 186.58 → 187

Offensive7.42
RateValueLeagueWeightContribution
Points per possession-sec0.1190.1070.42.577
Shooting %0.5710.4910.21.331
Assists per pass0.1820.0980.43.509

Σ contribution = 7.417

Defensive7.88
StatValueLeague rated(ratio)WeightContribution
Saves32.0237.7940.32.338
Blocks45.8174.790.20.958
Takeaways73.239.2940.252.323
Goals conceded36.5569.0460.252.262

Σ contribution = 7.881

League average is 6.0 on Performance, Offensive and Defensive, and 100 on Pucker+. Every formula.

EggsThink Ottawa Valley Island Boys

rated once over the whole game. Baseline: the player's own division.

Performance6.7
StatValueLeague avgStd devWeightzContribution
Goals41.931.730.231.1980.275
Assists31.581.410.191.010.192
Shots73.932.860.091.0750.097
Passes2116.116.640.080.7370.059
Saves02.022.210.19-0.914-0.174
Blocks55.824.350.11-0.188-0.021
Takeaways13.233.180.11-0.7-0.077

6.0 + clip(Σ 0.352 × 2, −3 to 3) = 6.703, nothing hit the bonus or penalty thresholds → 6.7

Pucker+124
StatValueLeague rateRatioWeightContribution
Goal contribution73.3752.0740.320.664
Shots73.9261.7830.080.143
Saves02.02300.150
Blocks55.8170.860.070.06
Takeaways13.230.310.120.037
Passes2116.1091.3040.080.104
Faceoff win rate0.80.51.60.030.048

Σ 1.056 ÷ Σ weights 0.85 = 1.242 → ×100 = 124.22 → 124

Offensive8.40
RateValueLeagueWeightContribution
Points per possession-sec0.3890.1070.43.983
Shooting %0.5710.4910.21.331
Assists per pass0.1430.0980.43.084

Σ contribution = 8.398

Defensive5.14
StatValueLeague rated(ratio)WeightContribution
Saves02.0232.9540.30.886
Blocks55.8175.4420.21.088
Takeaways13.233.6070.250.902
Goals conceded36.5569.0460.252.262

Σ contribution = 5.138

League average is 6.0 on Performance, Offensive and Defensive, and 100 on Pucker+. Every formula.

AboveAverageJoe Ottawa Valley Island Boys

rated once over the whole game. Baseline: the player's own division.

Performance7.3
StatValueLeague avgStd devWeightzContribution
Goals51.931.730.231.7750.408
Assists21.581.410.190.2990.057
Shots93.932.860.091.7740.16
Passes2316.116.640.081.0380.083
Saves12.022.210.19-0.462-0.088
Blocks45.824.350.11-0.418-0.046
Takeaways53.233.180.110.5560.061

6.0 + clip(Σ 0.635 × 2, −3 to 3) = 7.27, nothing hit the bonus or penalty thresholds → 7.3

Pucker+156
StatValueLeague rateRatioWeightContribution
Goal contribution73.3752.0740.320.664
Shots93.9262.2920.080.183
Saves12.0230.4940.150.074
Blocks45.8170.6880.070.048
Takeaways53.231.5480.120.186
Passes2316.1091.4280.080.114
Faceoff win rate10.520.030.06

Σ 1.329 ÷ Σ weights 0.85 = 1.564 → ×100 = 156.38 → 156

Offensive6.95
RateValueLeagueWeightContribution
Points per possession-sec0.1890.1070.43.426
Shooting %0.5560.4910.21.305
Assists per pass0.0870.0980.42.22

Σ contribution = 6.951

Defensive6.46
StatValueLeague rated(ratio)WeightContribution
Saves12.0234.1330.31.24
Blocks45.8174.790.20.958
Takeaways53.237.9970.251.999
Goals conceded36.5569.0460.252.262

Σ contribution = 6.459

League average is 6.0 on Performance, Offensive and Defensive, and 100 on Pucker+. Every formula.