SSHomeSeattle Storm
13–6Final
OVAwayOttawa Valley Island Boys

Dec 18, 2024 · Central B - Playoffs · Storm Stadium

MVP [SEA] V · 9.2 performance rating

Writing the recap…

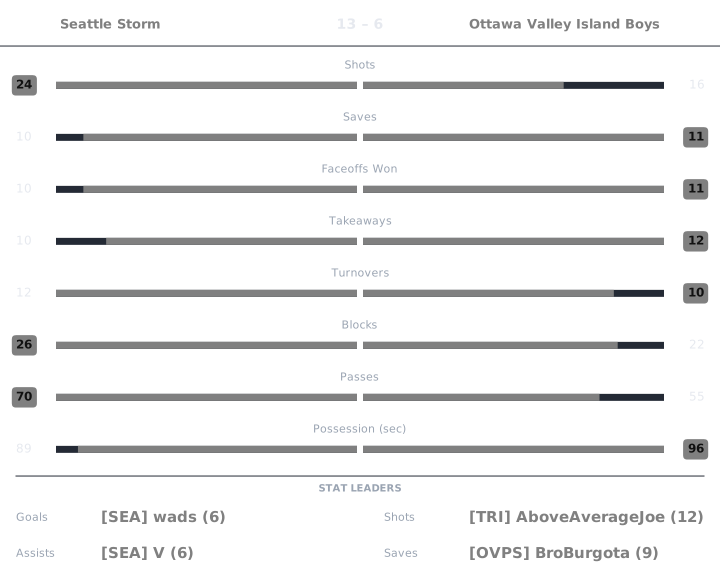
Match box score chart

Perf is a 0 to 10 Alto rating, 6.0 being league average. Click any Perf number to see the working behind it.

Seattle Storm

PlayerGAPtsShotsSavesFOWFOLTKTOBlkPassesGWGPossPerfPucker+OffDef
[SEA] Gronk235480152112400:541606.238.13
[SEA] V5611928455142100:291859.306.89
[SEA] wads628110260512500:061137.493.90

Ottawa Valley Island Boys

PlayerGAPtsShotsSavesFOWFOLTKTOBlkPassesGWGPossPerfPucker+OffDef
[OVPS] BroBurgota044294373162001:041635.958.20
[OVPS] EggsThink12322424321900:17777.024.96
[TRI] AboveAverageJoe516120351441600:151036.973.71

Gronk Seattle Storm

rated once over the whole game. Baseline: the player's own division.

Performance7.8
StatValueLeague avgStd devWeightzContribution
Goals22.041.840.23-0.023-0.005
Assists31.81.490.190.8070.153
Shots44.623.110.09-0.201-0.018
Passes2418.266.640.080.8640.069
Saves82.582.750.191.9720.375
Blocks117.014.640.110.860.095
Takeaways53.452.640.110.5870.065

6.0 + clip(Σ 0.733 × 2, −3 to 3) = 7.466, then +0.35 saves → 7.8

Pucker+160
StatValueLeague rateRatioWeightContribution
Goal contribution53.6771.360.320.435
Shots44.6240.8650.080.069
Saves82.5813.10.150.465
Blocks117.0111.5690.070.11
Takeaways53.4521.4490.120.174
Passes2418.2581.3140.080.105
Faceoff win rate00.500.030

Σ 1.358 ÷ Σ weights 0.85 = 1.598 → ×100 = 159.78 → 160

Offensive6.23
RateValueLeagueWeightContribution
Points per possession-sec0.0930.1140.42.105
Shooting %0.50.4420.21.305
Assists per pass0.1250.0980.42.823

Σ contribution = 6.233

Defensive8.13
StatValueLeague rated(ratio)WeightContribution
Saves82.5819.8820.32.965
Blocks117.0118.0590.21.612
Takeaways53.4527.6830.251.921
Goals conceded66.7746.5130.251.628

Σ contribution = 8.126

League average is 6.0 on Performance, Offensive and Defensive, and 100 on Pucker+. Every formula.

V Seattle Storm

rated once over the whole game. Baseline: the player's own division.

Performance9.2
StatValueLeague avgStd devWeightzContribution
Goals52.041.840.231.6060.369
Assists61.81.490.192.8160.535
Shots94.623.110.091.4090.127
Passes2118.266.640.080.4130.033
Saves22.582.750.19-0.211-0.04
Blocks147.014.640.111.5070.166
Takeaways53.452.640.110.5870.065

6.0 + clip(Σ 1.254 × 2, −3 to 3) = 8.509, then +0.4 playmaker, +0.3 blocks → 9.2

Pucker+185
StatValueLeague rateRatioWeightContribution
Goal contribution10.53.6772.8550.320.914
Shots94.6241.9470.080.156
Saves22.5810.7750.150.116
Blocks147.0111.9970.070.14
Takeaways53.4521.4490.120.174
Passes2118.2581.150.080.092
Faceoff win rate0.6670.51.3330.030.04

Σ 1.631 ÷ Σ weights 0.85 = 1.919 − 0.067 turnover penalty = 1.852 → ×100 = 185.19 → 185

Offensive9.30
RateValueLeagueWeightContribution
Points per possession-sec0.3790.1140.43.97
Shooting %0.5560.4420.21.401
Assists per pass0.2860.0980.43.931

Σ contribution = 9.302

Defensive6.89
StatValueLeague rated(ratio)WeightContribution
Saves22.5815.1150.31.534
Blocks147.0119.0410.21.808
Takeaways53.4527.6830.251.921
Goals conceded66.7746.5130.251.628

Σ contribution = 6.891

League average is 6.0 on Performance, Offensive and Defensive, and 100 on Pucker+. Every formula.

wads Seattle Storm

rated once over the whole game. Baseline: the player's own division.

Performance7.1
StatValueLeague avgStd devWeightzContribution
Goals62.041.840.232.1490.494
Assists21.81.490.190.1370.026
Shots114.623.110.092.0530.185
Passes2518.266.640.081.0150.081
Saves02.582.750.19-0.939-0.178
Blocks17.014.640.11-1.296-0.143
Takeaways03.452.640.11-1.308-0.144

6.0 + clip(Σ 0.321 × 2, −3 to 3) = 6.643, then +0.5 hat trick → 7.1

Pucker+113
StatValueLeague rateRatioWeightContribution
Goal contribution83.6772.1750.320.696
Shots114.6242.3790.080.19
Saves02.58100.150
Blocks17.0110.1430.070.01
Takeaways03.45200.120
Passes2518.2581.3690.080.11
Faceoff win rate0.250.50.50.030.015

Σ 1.021 ÷ Σ weights 0.85 = 1.201 − 0.067 turnover penalty = 1.134 → ×100 = 113.39 → 113

Offensive7.49
RateValueLeagueWeightContribution
Points per possession-sec1.3330.1140.44
Shooting %0.5450.4420.21.384
Assists per pass0.080.0980.42.105

Σ contribution = 7.489

Defensive3.90
StatValueLeague rated(ratio)WeightContribution
Saves02.5812.9540.30.886
Blocks17.0113.220.20.644
Takeaways03.4522.9540.250.738
Goals conceded66.7746.5130.251.628

Σ contribution = 3.896

League average is 6.0 on Performance, Offensive and Defensive, and 100 on Pucker+. Every formula.

BroBurgota Ottawa Valley Island Boys

rated once over the whole game. Baseline: the player's own division.

Performance7.8
StatValueLeague avgStd devWeightzContribution
Goals02.041.840.23-1.11-0.255
Assists41.81.490.191.4760.28
Shots24.623.110.09-0.845-0.076
Passes2018.266.640.080.2620.021
Saves92.582.750.192.3360.444
Blocks167.014.640.111.9380.213
Takeaways73.452.640.111.3440.148

6.0 + clip(Σ 0.775 × 2, −3 to 3) = 7.55, then +0.35 saves, +0.3 blocks, −0.2 cold shooting, −0.2 goals against → 7.8

Pucker+163
StatValueLeague rateRatioWeightContribution
Goal contribution3.53.6770.9520.320.305
Shots24.6240.4330.080.035
Saves92.5813.4880.150.523
Blocks167.0112.2820.070.16
Takeaways73.4522.0280.120.243
Passes2018.2581.0950.080.088
Faceoff win rate0.5710.51.1430.030.034

Σ 1.387 ÷ Σ weights 0.85 = 1.632 → ×100 = 163.22 → 163

Offensive5.95
RateValueLeagueWeightContribution
Points per possession-sec0.0630.1140.41.724
Shooting %00.4420.20.591
Assists per pass0.20.0980.43.64

Σ contribution = 5.955

Defensive8.20
StatValueLeague rated(ratio)WeightContribution
Saves92.5819.9450.32.984
Blocks167.0119.4280.21.886
Takeaways73.4529.0920.252.273
Goals conceded136.7744.2190.251.055

Σ contribution = 8.198

League average is 6.0 on Performance, Offensive and Defensive, and 100 on Pucker+. Every formula.

EggsThink Ottawa Valley Island Boys

rated once over the whole game. Baseline: the player's own division.

Performance5.2
StatValueLeague avgStd devWeightzContribution
Goals12.041.840.23-0.567-0.13
Assists21.81.490.190.1370.026
Shots24.623.110.09-0.845-0.076
Passes1918.266.640.080.1120.009
Saves22.582.750.19-0.211-0.04
Blocks27.014.640.11-1.08-0.119
Takeaways43.452.640.110.2080.023

6.0 + clip(Σ −0.308 × 2, −3 to 3) = 5.385, then −0.2 goals against → 5.2

Pucker+77
StatValueLeague rateRatioWeightContribution
Goal contribution2.53.6770.680.320.218
Shots24.6240.4330.080.035
Saves22.5810.7750.150.116
Blocks27.0110.2850.070.02
Takeaways43.4521.1590.120.139
Passes1918.2581.0410.080.083
Faceoff win rate0.6670.51.3330.030.04

Σ 0.651 ÷ Σ weights 0.85 = 0.766 → ×100 = 76.55 → 77

Offensive7.02
RateValueLeagueWeightContribution
Points per possession-sec0.1760.1140.43.201
Shooting %0.50.4420.21.305
Assists per pass0.1050.0980.42.512

Σ contribution = 7.018

Defensive4.96
StatValueLeague rated(ratio)WeightContribution
Saves22.5815.1150.31.534
Blocks27.0113.5450.20.709
Takeaways43.4526.630.251.658
Goals conceded136.7744.2190.251.055

Σ contribution = 4.956

League average is 6.0 on Performance, Offensive and Defensive, and 100 on Pucker+. Every formula.

AboveAverageJoe Ottawa Valley Island Boys

rated once over the whole game. Baseline: the player's own division.

Performance6.0
StatValueLeague avgStd devWeightzContribution
Goals52.041.840.231.6060.369
Assists11.81.490.19-0.533-0.101
Shots124.623.110.092.3740.214
Passes1618.266.640.08-0.34-0.027
Saves02.582.750.19-0.939-0.178
Blocks47.014.640.11-0.649-0.071
Takeaways13.452.640.11-0.929-0.102

6.0 + clip(Σ 0.103 × 2, −3 to 3) = 6.205, then −0.2 goals against → 6.0

Pucker+103
StatValueLeague rateRatioWeightContribution
Goal contribution63.6771.6320.320.522
Shots124.6242.5950.080.208
Saves02.58100.150
Blocks47.0110.5710.070.04
Takeaways13.4520.290.120.035
Passes1618.2580.8760.080.07
Faceoff win rate0.3750.50.750.030.022

Σ 0.897 ÷ Σ weights 0.85 = 1.055 − 0.024 turnover penalty = 1.031 → ×100 = 103.15 → 103

Offensive6.97
RateValueLeagueWeightContribution
Points per possession-sec0.40.1140.43.979
Shooting %0.4170.4420.21.154
Assists per pass0.0620.0980.41.841

Σ contribution = 6.975

Defensive3.71
StatValueLeague rated(ratio)WeightContribution
Saves02.5812.9540.30.886
Blocks47.0114.3810.20.876
Takeaways13.4523.5570.250.889
Goals conceded136.7744.2190.251.055

Σ contribution = 3.706

League average is 6.0 on Performance, Offensive and Defensive, and 100 on Pucker+. Every formula.