SSHomeSeattle Storm
8–3Final
OVAwayOttawa Valley Island Boys

Oct 16, 2024 · Central B · Storm Stadium

MVP [SEA] V · 7.2 performance rating

Writing the recap…

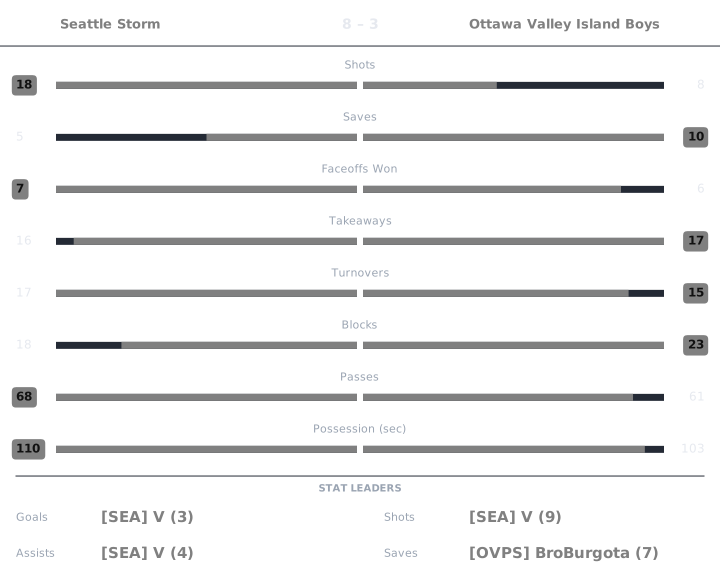
Match box score chart

Perf is a 0 to 10 Alto rating, 6.0 being league average. Click any Perf number to see the working behind it.

Seattle Storm

PlayerGAPtsShotsSavesFOWFOLTKTOBlkPassesGWGPossPerfPucker+OffDef
[SEA] Gronk23532505562300:581055.917.06
[SEA] V34792148592300:361427.147.83
[SEA] wads33661123732200:16917.825.67

Ottawa Valley Island Boys

PlayerGAPtsShotsSavesFOWFOLTKTOBlkPassesGWGPossPerfPucker+OffDef
[DCU] kman0110012012900:00194.163.80
[OVPS] BroBurgota011272310782100:471173.468.24
[OVPS] EggsThink20231212321500:18574.704.51
[OVSS] trevwings10121111211800:13474.095.21
[TRI] AboveAverageJoe0111100420800:25414.604.96

Gronk Seattle Storm

rated once over the whole game. Baseline: the player's own division.

Performance6.5
StatValueLeague avgStd devWeightzContribution
Goals22.251.880.23-0.134-0.031
Assists321.710.190.5830.111
Shots34.373.050.09-0.449-0.04
Passes2317.897.650.080.6680.053
Saves22.132.190.19-0.058-0.011
Blocks66.784.760.11-0.163-0.018
Takeaways53.342.980.110.5550.061

6.0 + clip(Σ 0.125 × 2, −3 to 3) = 6.25, then +0.25 hot shooting → 6.5

Pucker+105
StatValueLeague rateRatioWeightContribution
Goal contribution4.54.0661.1070.320.354
Shots34.370.6860.080.055
Saves22.1260.9410.150.141
Blocks66.7780.8850.070.062
Takeaways53.3441.4950.120.179
Passes2317.8931.2850.080.103
Faceoff win rate10.4982.0090.030.06

Σ 0.955 ÷ Σ weights 0.85 = 1.123 − 0.073 turnover penalty = 1.05 → ×100 = 105.02 → 105

Offensive5.91
RateValueLeagueWeightContribution
Points per possession-sec0.0860.1390.41.821
Shooting %0.6670.5150.21.428
Assists per pass0.130.1120.42.663

Σ contribution = 5.912

Defensive7.06
StatValueLeague rated(ratio)WeightContribution
Saves22.1265.7630.31.729
Blocks66.7785.5430.21.109
Takeaways53.3447.8330.251.958
Goals conceded37.6679.0460.252.262

Σ contribution = 7.058

League average is 6.0 on Performance, Offensive and Defensive, and 100 on Pucker+. Every formula.

V Seattle Storm

rated once over the whole game. Baseline: the player's own division.

Performance7.2
StatValueLeague avgStd devWeightzContribution
Goals32.251.880.230.3970.091
Assists421.710.191.1680.222
Shots94.373.050.091.5170.137
Passes2317.897.650.080.6680.053
Saves22.132.190.19-0.058-0.011
Blocks96.784.760.110.4670.051
Takeaways83.342.980.111.560.172

6.0 + clip(Σ 0.715 × 2, −3 to 3) = 7.43, then −0.2 cold shooting → 7.2

Pucker+142
StatValueLeague rateRatioWeightContribution
Goal contribution64.0661.4750.320.472
Shots94.372.0590.080.165
Saves22.1260.9410.150.141
Blocks96.7781.3280.070.093
Takeaways83.3442.3920.120.287
Passes2317.8931.2850.080.103
Faceoff win rate0.20.4980.4020.030.012

Σ 1.273 ÷ Σ weights 0.85 = 1.498 − 0.073 turnover penalty = 1.425 → ×100 = 142.47 → 142

Offensive7.14
RateValueLeagueWeightContribution
Points per possession-sec0.1940.1390.43.01
Shooting %0.3330.5150.20.928
Assists per pass0.1740.1120.43.206

Σ contribution = 7.144

Defensive7.83
StatValueLeague rated(ratio)WeightContribution
Saves22.1265.7630.31.729
Blocks96.7787.2660.21.453
Takeaways83.3449.5350.252.384
Goals conceded37.6679.0460.252.262

Σ contribution = 7.828

League average is 6.0 on Performance, Offensive and Defensive, and 100 on Pucker+. Every formula.

wads Seattle Storm

rated once over the whole game. Baseline: the player's own division.

Performance5.9
StatValueLeague avgStd devWeightzContribution
Goals32.251.880.230.3970.091
Assists321.710.190.5830.111
Shots64.373.050.090.5340.048
Passes2217.897.650.080.5370.043
Saves12.132.190.19-0.514-0.098
Blocks36.784.760.11-0.794-0.087
Takeaways33.342.980.11-0.115-0.013

6.0 + clip(Σ 0.095 × 2, −3 to 3) = 6.191, then −0.3 turnovers → 5.9

Pucker+91
StatValueLeague rateRatioWeightContribution
Goal contribution64.0661.4750.320.472
Shots64.371.3730.080.11
Saves12.1260.470.150.071
Blocks36.7780.4430.070.031
Takeaways33.3440.8970.120.108
Passes2217.8931.230.080.098
Faceoff win rate0.3330.4980.670.030.02

Σ 0.91 ÷ Σ weights 0.85 = 1.07 − 0.162 turnover penalty = 0.908 → ×100 = 90.82 → 91

Offensive7.82
RateValueLeagueWeightContribution
Points per possession-sec0.3750.1390.43.897
Shooting %0.50.5150.21.176
Assists per pass0.1360.1120.42.744

Σ contribution = 7.818

Defensive5.67
StatValueLeague rated(ratio)WeightContribution
Saves12.1264.0590.31.218
Blocks36.7783.9760.20.795
Takeaways33.3445.590.251.397
Goals conceded37.6679.0460.252.262

Σ contribution = 5.672

League average is 6.0 on Performance, Offensive and Defensive, and 100 on Pucker+. Every formula.

kman Ottawa Valley Island Boys

rated once over the whole game. Baseline: the player's own division.

Performance3.7
StatValueLeague avgStd devWeightzContribution
Goals02.251.880.23-1.196-0.275
Assists121.710.19-0.586-0.111
Shots04.373.050.09-1.432-0.129
Passes917.897.650.08-1.163-0.093
Saves02.132.190.19-0.97-0.184
Blocks26.784.760.11-1.004-0.11
Takeaways03.342.980.11-1.121-0.123

6.0 + clip(Σ −1.026 × 2, −3 to 3) = 3.947, then −0.2 goals against → 3.7

Pucker+19
StatValueLeague rateRatioWeightContribution
Goal contribution14.0660.2460.320.079
Shots04.3700.080
Saves02.12600.150
Blocks26.7780.2950.070.021
Takeaways03.34400.120
Passes917.8930.5030.080.04
Faceoff win rate0.3330.4980.670.030.02

Σ 0.16 ÷ Σ weights 0.85 = 0.188 → ×100 = 18.79 → 19

Offensive4.16
RateValueLeagueWeightContribution
Points per possession-sec00.1390.41.181
Shooting %00.5150.20.591
Assists per pass0.1110.1120.42.389

Σ contribution = 4.161

Defensive3.80
StatValueLeague rated(ratio)WeightContribution
Saves02.1262.9540.30.886
Blocks26.7783.570.20.714
Takeaways03.3442.9540.250.738
Goals conceded87.6675.8330.251.458

Σ contribution = 3.796

League average is 6.0 on Performance, Offensive and Defensive, and 100 on Pucker+. Every formula.

BroBurgota Ottawa Valley Island Boys

rated once over the whole game. Baseline: the player's own division.

Performance6.2
StatValueLeague avgStd devWeightzContribution
Goals02.251.880.23-1.196-0.275
Assists121.710.19-0.586-0.111
Shots24.373.050.09-0.777-0.07
Passes2117.897.650.080.4060.032
Saves72.132.190.192.2230.422
Blocks86.784.760.110.2570.028
Takeaways103.342.980.112.230.245

6.0 + clip(Σ 0.272 × 2, −3 to 3) = 6.544, then +0.35 saves, −0.3 turnovers, −0.2 cold shooting, −0.2 goals against → 6.2

Pucker+117
StatValueLeague rateRatioWeightContribution
Goal contribution0.54.0660.1230.320.039
Shots24.370.4580.080.037
Saves72.1263.2920.150.494
Blocks86.7781.180.070.083
Takeaways103.3442.990.120.359
Passes2117.8931.1740.080.094
Faceoff win rate0.40.4980.8030.030.024

Σ 1.129 ÷ Σ weights 0.85 = 1.328 − 0.162 turnover penalty = 1.166 → ×100 = 116.65 → 117

Offensive3.46
RateValueLeagueWeightContribution
Points per possession-sec0.0210.1390.41.297
Shooting %00.5150.20.591
Assists per pass0.0480.1120.41.57

Σ contribution = 3.458

Defensive8.24
StatValueLeague rated(ratio)WeightContribution
Saves72.1269.9190.32.976
Blocks86.7786.7140.21.343
Takeaways103.3449.8530.252.463
Goals conceded87.6675.8330.251.458

Σ contribution = 8.24

League average is 6.0 on Performance, Offensive and Defensive, and 100 on Pucker+. Every formula.

EggsThink Ottawa Valley Island Boys

rated once over the whole game. Baseline: the player's own division.

Performance4.9
StatValueLeague avgStd devWeightzContribution
Goals22.251.880.23-0.134-0.031
Assists021.710.19-1.17-0.222
Shots34.373.050.09-0.449-0.04
Passes1517.897.650.08-0.378-0.03
Saves12.132.190.19-0.514-0.098
Blocks26.784.760.11-1.004-0.11
Takeaways23.342.980.11-0.45-0.05

6.0 + clip(Σ −0.581 × 2, −3 to 3) = 4.837, then +0.25 hot shooting, −0.2 goals against → 4.9

Pucker+57
StatValueLeague rateRatioWeightContribution
Goal contribution24.0660.4920.320.157
Shots34.370.6860.080.055
Saves12.1260.470.150.071
Blocks26.7780.2950.070.021
Takeaways23.3440.5980.120.072
Passes1517.8930.8380.080.067
Faceoff win rate0.6670.4981.3390.030.04

Σ 0.483 ÷ Σ weights 0.85 = 0.568 → ×100 = 56.76 → 57

Offensive4.70
RateValueLeagueWeightContribution
Points per possession-sec0.1110.1390.42.085
Shooting %0.6670.5150.21.428
Assists per pass00.1120.41.181

Σ contribution = 4.695

Defensive4.51
StatValueLeague rated(ratio)WeightContribution
Saves12.1264.0590.31.218
Blocks26.7783.570.20.714
Takeaways23.3444.4740.251.118
Goals conceded87.6675.8330.251.458

Σ contribution = 4.508

League average is 6.0 on Performance, Offensive and Defensive, and 100 on Pucker+. Every formula.

trevwings Ottawa Valley Island Boys

rated once over the whole game. Baseline: the player's own division.

Performance4.5
StatValueLeague avgStd devWeightzContribution
Goals12.251.880.23-0.665-0.153
Assists021.710.19-1.17-0.222
Shots24.373.050.09-0.777-0.07
Passes817.897.650.08-1.293-0.103
Saves12.132.190.19-0.514-0.098
Blocks116.784.760.110.8870.098
Takeaways13.342.980.11-0.785-0.086

6.0 + clip(Σ −0.635 × 2, −3 to 3) = 4.73, then −0.2 goals against → 4.5

Pucker+47
StatValueLeague rateRatioWeightContribution
Goal contribution14.0660.2460.320.079
Shots24.370.4580.080.037
Saves12.1260.470.150.071
Blocks116.7781.6230.070.114
Takeaways13.3440.2990.120.036
Passes817.8930.4470.080.036
Faceoff win rate0.50.4981.0040.030.03

Σ 0.401 ÷ Σ weights 0.85 = 0.472 → ×100 = 47.2 → 47

Offensive4.09
RateValueLeagueWeightContribution
Points per possession-sec0.0770.1390.41.731
Shooting %0.50.5150.21.176
Assists per pass00.1120.41.181

Σ contribution = 4.088

Defensive5.21
StatValueLeague rated(ratio)WeightContribution
Saves12.1264.0590.31.218
Blocks116.7788.2130.21.643
Takeaways13.3443.580.250.895
Goals conceded87.6675.8330.251.458

Σ contribution = 5.214

League average is 6.0 on Performance, Offensive and Defensive, and 100 on Pucker+. Every formula.

AboveAverageJoe Ottawa Valley Island Boys

rated once over the whole game. Baseline: the player's own division.

Performance4.0
StatValueLeague avgStd devWeightzContribution
Goals02.251.880.23-1.196-0.275
Assists121.710.19-0.586-0.111
Shots14.373.050.09-1.105-0.099
Passes817.897.650.08-1.293-0.103
Saves12.132.190.19-0.514-0.098
Blocks06.784.760.11-1.424-0.157
Takeaways43.342.980.110.220.024

6.0 + clip(Σ −0.819 × 2, −3 to 3) = 4.361, then −0.2 cold shooting, −0.2 goals against → 4.0

Pucker+41
StatValueLeague rateRatioWeightContribution
Goal contribution14.0660.2460.320.079
Shots14.370.2290.080.018
Saves12.1260.470.150.071
Blocks06.77800.070
Takeaways43.3441.1960.120.144
Passes817.8930.4470.080.036
Faceoff win rate00.49800.030

Σ 0.347 ÷ Σ weights 0.85 = 0.408 → ×100 = 40.8 → 41

Offensive4.60
RateValueLeagueWeightContribution
Points per possession-sec0.040.1390.41.421
Shooting %00.5150.20.591
Assists per pass0.1250.1120.42.587

Σ contribution = 4.598

Defensive4.96
StatValueLeague rated(ratio)WeightContribution
Saves12.1264.0590.31.218
Blocks06.7782.9540.20.591
Takeaways43.3446.7740.251.694
Goals conceded87.6675.8330.251.458

Σ contribution = 4.961

League average is 6.0 on Performance, Offensive and Defensive, and 100 on Pucker+. Every formula.