THHomeTortola Hellcats
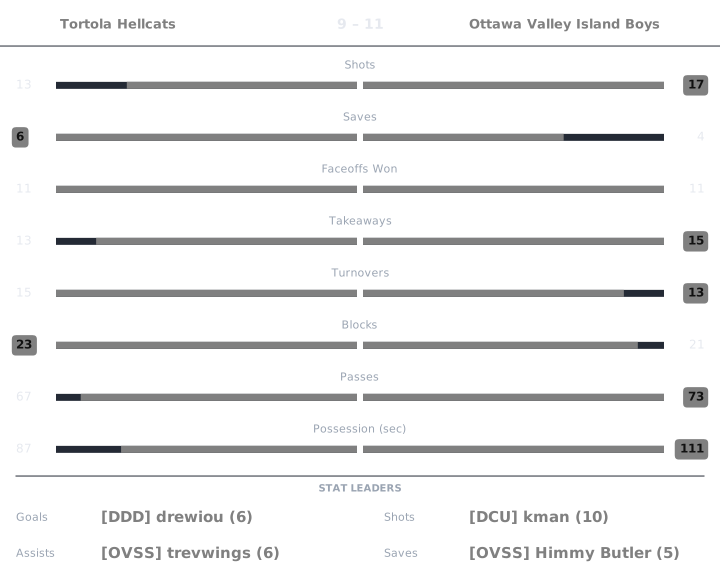
9–11Final
OVAwayOttawa Valley Island Boys

Sep 3, 2024 · Central C - Playoffs · Air Canada Centre

MVP [DCU] kman · 7.9 performance rating

Writing the recap…

Match box score chart

APR is the Alto Performance Rating: 0 to 10, with 6.0 league average. Click any APR to see the working.

Tortola Hellcats

PlayerGAPtsShotsSavesFOWFOLTKTOBlkPassesGWGPossAPRPucker+OffDef
[DDD] drewiou61780741591800:201337.534.34
[OVSS] Himmy Butler13425242492100:311367.946.57
[THC] Buzzy224312310652800:361186.695.81

Ottawa Valley Island Boys

PlayerGAPtsShotsSavesFOWFOLTKTOBlkPassesGWGPossAPRPucker+OffDef
[DCU] kman549101331362900:201778.664.50
[OVPS] EggsThink61771526451800:251567.635.45
[OVSS] trevwings066023686102601:061317.107.00

drewiou Tortola Hellcats

rated once over the whole game. Baseline: the player's own division.

APR7.5
StatValueLeague avgStd devWeightzContribution
Goals61.761.590.232.6650.613
Assists11.471.270.19-0.371-0.07
Shots83.512.330.091.9230.173
Passes1819.176.040.08-0.194-0.016
Saves01.761.820.19-0.965-0.183
Blocks96.134.160.110.690.076
Takeaways14.043.140.11-0.97-0.107

6.0 + clip(Σ 0.486 × 2, −3 to 3) = 6.972, then +0.5 hat trick, +0.25 hot shooting, −0.2 goals against → 7.5

Pucker+133
StatValueLeague rateRatioWeightContribution
Goal contribution73.0642.2840.320.731
Shots83.5142.2760.080.182
Saves01.75700.150
Blocks96.1291.4690.070.103
Takeaways14.0430.2470.120.03
Passes1819.1710.9390.080.075
Faceoff win rate0.6360.51.2730.030.038

Σ 1.159 ÷ Σ weights 0.85 = 1.363 − 0.036 turnover penalty = 1.327 → ×100 = 132.79 → 133

Offensive7.53
RateValueLeagueWeightContribution
Points per possession-sec0.350.0820.43.995
Shooting %0.750.50.21.57
Assists per pass0.0560.0770.41.969

Σ contribution = 7.534

Defensive4.34
StatValueLeague rated(ratio)WeightContribution
Saves01.7572.9540.30.886
Blocks96.1297.7480.21.55
Takeaways14.0433.4530.250.863
Goals conceded115.5714.1720.251.043

Σ contribution = 4.342

League average is 6.0 on APR, Offensive and Defensive, and 100 on Pucker+. Every formula.

Himmy Butler Tortola Hellcats

rated once over the whole game. Baseline: the player's own division.

APR6.7
StatValueLeague avgStd devWeightzContribution
Goals11.761.590.23-0.476-0.109
Assists31.471.270.191.2030.229
Shots23.512.330.09-0.649-0.058
Passes2119.176.040.080.3030.024
Saves51.761.820.191.7810.338
Blocks96.134.160.110.690.076
Takeaways24.043.140.11-0.651-0.072

6.0 + clip(Σ 0.427 × 2, −3 to 3) = 6.855, then −0.2 goals against → 6.7

Pucker+136
StatValueLeague rateRatioWeightContribution
Goal contribution43.0641.3050.320.418
Shots23.5140.5690.080.046
Saves51.7572.8460.150.427
Blocks96.1291.4690.070.103
Takeaways24.0430.4950.120.059
Passes2119.1711.0950.080.088
Faceoff win rate0.3330.50.6670.030.02

Σ 1.16 ÷ Σ weights 0.85 = 1.365 → ×100 = 136.45 → 136

Offensive7.94
RateValueLeagueWeightContribution
Points per possession-sec0.1290.0820.43.225
Shooting %0.50.50.21.2
Assists per pass0.1430.0770.43.515

Σ contribution = 7.94

Defensive6.57
StatValueLeague rated(ratio)WeightContribution
Saves51.7579.8050.32.942
Blocks96.1297.7480.21.55
Takeaways24.0434.1350.251.034
Goals conceded115.5714.1720.251.043

Σ contribution = 6.569

League average is 6.0 on APR, Offensive and Defensive, and 100 on Pucker+. Every formula.

Buzzy Tortola Hellcats

rated once over the whole game. Baseline: the player's own division.

APR6.4
StatValueLeague avgStd devWeightzContribution
Goals21.761.590.230.1530.035
Assists21.471.270.190.4160.079
Shots33.512.330.09-0.22-0.02
Passes2819.176.040.081.4630.117
Saves11.761.820.19-0.416-0.079
Blocks56.134.160.11-0.271-0.03
Takeaways104.043.140.111.8990.209

6.0 + clip(Σ 0.311 × 2, −3 to 3) = 6.623, then +0.25 hot shooting, −0.3 turnovers, −0.2 goals against → 6.4

Pucker+118
StatValueLeague rateRatioWeightContribution
Goal contribution43.0641.3050.320.418
Shots33.5140.8540.080.068
Saves11.7570.5690.150.085
Blocks56.1290.8160.070.057
Takeaways104.0432.4730.120.297
Passes2819.1711.4610.080.117
Faceoff win rate0.40.50.80.030.024

Σ 1.066 ÷ Σ weights 0.85 = 1.254 − 0.073 turnover penalty = 1.181 → ×100 = 118.17 → 118

Offensive6.69
RateValueLeagueWeightContribution
Points per possession-sec0.1110.0820.42.942
Shooting %0.6670.50.21.457
Assists per pass0.0710.0770.42.289

Σ contribution = 6.688

Defensive5.81
StatValueLeague rated(ratio)WeightContribution
Saves11.7574.3760.31.313
Blocks56.1295.2720.21.054
Takeaways104.0439.6010.252.4
Goals conceded115.5714.1720.251.043

Σ contribution = 5.81

League average is 6.0 on APR, Offensive and Defensive, and 100 on Pucker+. Every formula.

kman Ottawa Valley Island Boys

rated once over the whole game. Baseline: the player's own division.

APR7.9
StatValueLeague avgStd devWeightzContribution
Goals51.761.590.232.0370.469
Assists41.471.270.191.990.378
Shots103.512.330.092.780.25
Passes2919.176.040.081.6280.13
Saves11.761.820.19-0.416-0.079
Blocks66.134.160.11-0.031-0.003
Takeaways14.043.140.11-0.97-0.107

6.0 + clip(Σ 1.038 × 2, −3 to 3) = 8.076, then −0.2 goals against → 7.9

Pucker+177
StatValueLeague rateRatioWeightContribution
Goal contribution93.0642.9370.320.94
Shots103.5142.8460.080.228
Saves11.7570.5690.150.085
Blocks66.1290.9790.070.069
Takeaways14.0430.2470.120.03
Passes2919.1711.5130.080.121
Faceoff win rate0.50.510.030.03

Σ 1.502 ÷ Σ weights 0.85 = 1.767 → ×100 = 176.72 → 177

Offensive8.66
RateValueLeagueWeightContribution
Points per possession-sec0.450.0820.44
Shooting %0.50.50.21.2
Assists per pass0.1380.0770.43.46

Σ contribution = 8.659

Defensive4.50
StatValueLeague rated(ratio)WeightContribution
Saves11.7574.3760.31.313
Blocks66.1295.9160.21.183
Takeaways14.0433.4530.250.863
Goals conceded95.5714.5460.251.136

Σ contribution = 4.495

League average is 6.0 on APR, Offensive and Defensive, and 100 on Pucker+. Every formula.

EggsThink Ottawa Valley Island Boys

rated once over the whole game. Baseline: the player's own division.

APR7.8
StatValueLeague avgStd devWeightzContribution
Goals61.761.590.232.6650.613
Assists11.471.270.19-0.371-0.07
Shots73.512.330.091.4940.134
Passes1819.176.040.08-0.194-0.016
Saves11.761.820.19-0.416-0.079
Blocks56.134.160.11-0.271-0.03
Takeaways64.043.140.110.6240.069

6.0 + clip(Σ 0.621 × 2, −3 to 3) = 7.243, then +0.5 hat trick, +0.25 hot shooting, −0.2 goals against → 7.8

Pucker+156
StatValueLeague rateRatioWeightContribution
Goal contribution73.0642.2840.320.731
Shots73.5141.9920.080.159
Saves11.7570.5690.150.085
Blocks56.1290.8160.070.057
Takeaways64.0431.4840.120.178
Passes1819.1710.9390.080.075
Faceoff win rate0.7140.51.4290.030.043

Σ 1.329 ÷ Σ weights 0.85 = 1.563 → ×100 = 156.34 → 156

Offensive7.63
RateValueLeagueWeightContribution
Points per possession-sec0.280.0820.43.974
Shooting %0.8570.50.21.691
Assists per pass0.0560.0770.41.969

Σ contribution = 7.634

Defensive5.45
StatValueLeague rated(ratio)WeightContribution
Saves11.7574.3760.31.313
Blocks56.1295.2720.21.054
Takeaways64.0437.7980.251.95
Goals conceded95.5714.5460.251.136

Σ contribution = 5.453

League average is 6.0 on APR, Offensive and Defensive, and 100 on Pucker+. Every formula.

trevwings Ottawa Valley Island Boys

rated once over the whole game. Baseline: the player's own division.

APR7.2
StatValueLeague avgStd devWeightzContribution
Goals01.761.590.23-1.104-0.254
Assists61.471.270.193.5630.677
Shots03.512.330.09-1.506-0.136
Passes2619.176.040.081.1310.091
Saves21.761.820.190.1330.025
Blocks106.134.160.110.930.102
Takeaways84.043.140.111.2620.139

6.0 + clip(Σ 0.644 × 2, −3 to 3) = 7.289, then +0.4 playmaker, −0.3 turnovers, −0.2 goals against → 7.2

Pucker+131
StatValueLeague rateRatioWeightContribution
Goal contribution53.0641.6320.320.522
Shots03.51400.080
Saves21.7571.1380.150.171
Blocks106.1291.6320.070.114
Takeaways84.0431.9790.120.237
Passes2619.1711.3560.080.108
Faceoff win rate0.3330.50.6670.030.02

Σ 1.173 ÷ Σ weights 0.85 = 1.38 − 0.073 turnover penalty = 1.307 → ×100 = 130.74 → 131

Offensive7.10
RateValueLeagueWeightContribution
Points per possession-sec0.0910.0820.42.57
Shooting %00.50.20.591
Assists per pass0.2310.0770.43.943

Σ contribution = 7.104

Defensive7.00
StatValueLeague rated(ratio)WeightContribution
Saves21.7576.5490.31.965
Blocks106.1298.2370.21.647
Takeaways84.0439.010.252.253
Goals conceded95.5714.5460.251.136

Σ contribution = 7.001

League average is 6.0 on APR, Offensive and Defensive, and 100 on Pucker+. Every formula.