OVHomeOttawa Valley Island Boys
5–3Final
THAwayTortola Hellcats

Jul 16, 2024 · Central C · The Island

MVP [OVSS] trevwings · 7.3 performance rating

Writing the recap…

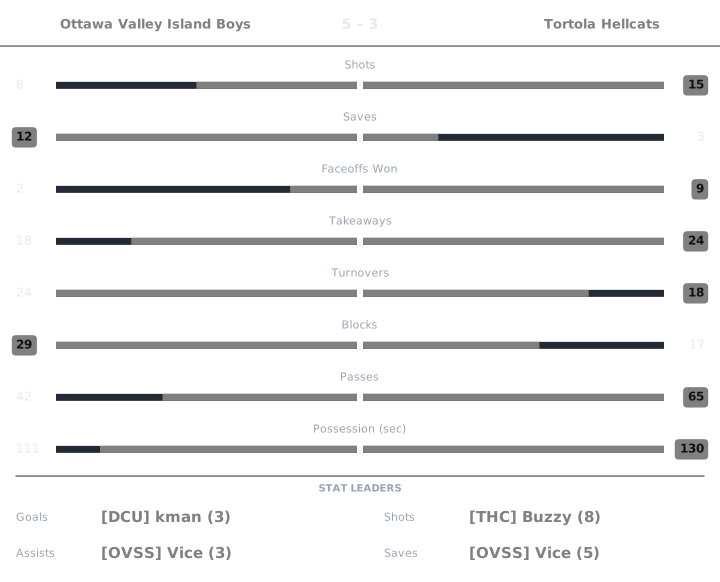
Match box score chart

Perf is a 0 to 10 Alto rating, 6.0 being league average. Click any Perf number to see the working behind it.

Ottawa Valley Island Boys

PlayerGAPtsShotsSavesFOWFOLTKTOBlkPassesGWGPossPerfPucker+OffDef
[DCU] kman30341017341200:241015.966.67
[OVPS] EggsThink1012101131300:05346.274.97
[OVSS] Vice0330504087800:07708.597.15
[OVSS] trevwings11225231010171901:151254.649.49

Tortola Hellcats

PlayerGAPtsShotsSavesFOWFOLTKTOBlkPassesGWGPossPerfPucker+OffDef
[DDD] drewiou01120307521400:32584.385.52
[OVSS] Himmy Butler101223186101700:49873.847.45
[THC] Buzzy11281018732600:36924.236.06
[THC] DonJuan1123030102800:13467.764.12

kman Ottawa Valley Island Boys

rated once over the whole game. Baseline: the player's own division.

Performance6.2
StatValueLeague avgStd devWeightzContribution
Goals31.661.580.230.8460.195
Assists01.261.250.19-1.006-0.191
Shots43.692.840.090.110.01
Passes1216.356.960.08-0.624-0.05
Saves12.032.250.19-0.458-0.087
Blocks45.914.130.11-0.463-0.051
Takeaways73.352.920.111.250.138

6.0 + clip(Σ −0.037 × 2, −3 to 3) = 5.926, then +0.25 hot shooting → 6.2

Pucker+101
StatValueLeague rateRatioWeightContribution
Goal contribution32.8381.0570.320.338
Shots43.6871.0850.080.087
Saves12.0320.4920.150.074
Blocks45.9120.6770.070.047
Takeaways73.3542.0870.120.25
Passes1216.3470.7340.080.059
Faceoff win rate00.500.030

Σ 0.855 ÷ Σ weights 0.85 = 1.006 → ×100 = 100.64 → 101

Offensive5.96
RateValueLeagueWeightContribution
Points per possession-sec0.1250.0850.43.11
Shooting %0.750.450.21.666
Assists per pass00.0770.41.181

Σ contribution = 5.957

Defensive6.67
StatValueLeague rated(ratio)WeightContribution
Saves12.0324.1270.31.238
Blocks45.9124.750.20.95
Takeaways73.3549.1830.252.296
Goals conceded35.5258.7470.252.187

Σ contribution = 6.671

League average is 6.0 on Performance, Offensive and Defensive, and 100 on Pucker+. Every formula.

EggsThink Ottawa Valley Island Boys

rated once over the whole game. Baseline: the player's own division.

Performance4.4
StatValueLeague avgStd devWeightzContribution
Goals11.661.580.23-0.417-0.096
Assists01.261.250.19-1.006-0.191
Shots23.692.840.09-0.594-0.054
Passes316.356.960.08-1.917-0.153
Saves12.032.250.19-0.458-0.087
Blocks15.914.130.11-1.19-0.131
Takeaways13.352.920.11-0.807-0.089

6.0 + clip(Σ −0.801 × 2, −3 to 3) = 4.399, nothing hit the bonus or penalty thresholds → 4.4

Pucker+34
StatValueLeague rateRatioWeightContribution
Goal contribution12.8380.3520.320.113
Shots23.6870.5430.080.043
Saves12.0320.4920.150.074
Blocks15.9120.1690.070.012
Takeaways13.3540.2980.120.036
Passes316.3470.1840.080.015
Faceoff win rate00.500.030

Σ 0.292 ÷ Σ weights 0.85 = 0.344 → ×100 = 34.39 → 34

Offensive6.27
RateValueLeagueWeightContribution
Points per possession-sec0.20.0850.43.803
Shooting %0.50.450.21.288
Assists per pass00.0770.41.181

Σ contribution = 6.273

Defensive4.97
StatValueLeague rated(ratio)WeightContribution
Saves12.0324.1270.31.238
Blocks15.9123.2760.20.655
Takeaways13.3543.5780.250.894
Goals conceded35.5258.7470.252.187

Σ contribution = 4.974

League average is 6.0 on Performance, Offensive and Defensive, and 100 on Pucker+. Every formula.

Vice Ottawa Valley Island Boys

rated once over the whole game. Baseline: the player's own division.

Performance5.6
StatValueLeague avgStd devWeightzContribution
Goals01.661.580.23-1.049-0.241
Assists31.261.250.191.3850.263
Shots03.692.840.09-1.299-0.117
Passes816.356.960.08-1.199-0.096
Saves52.032.250.191.3170.25
Blocks75.914.130.110.2640.029
Takeaways03.352.920.11-1.15-0.127

6.0 + clip(Σ −0.038 × 2, −3 to 3) = 5.924, then −0.3 turnovers → 5.6

Pucker+70
StatValueLeague rateRatioWeightContribution
Goal contribution2.52.8380.8810.320.282
Shots03.68700.080
Saves52.0322.4610.150.369
Blocks75.9121.1840.070.083
Takeaways03.35400.120
Passes816.3470.4890.080.039
Faceoff win rate00.500.030

Σ 0.773 ÷ Σ weights 0.85 = 0.909 − 0.209 turnover penalty = 0.7 → ×100 = 70.08 → 70

Offensive8.59
RateValueLeagueWeightContribution
Points per possession-sec0.4290.0850.43.999
Shooting %00.450.20.591
Assists per pass0.3750.0770.43.999

Σ contribution = 8.588

Defensive7.15
StatValueLeague rated(ratio)WeightContribution
Saves52.0329.5910.32.877
Blocks75.9126.7280.21.346
Takeaways03.3542.9540.250.738
Goals conceded35.5258.7470.252.187

Σ contribution = 7.148

League average is 6.0 on Performance, Offensive and Defensive, and 100 on Pucker+. Every formula.

trevwings Ottawa Valley Island Boys

rated once over the whole game. Baseline: the player's own division.

Performance7.3
StatValueLeague avgStd devWeightzContribution
Goals11.661.580.23-0.417-0.096
Assists11.261.250.19-0.209-0.04
Shots23.692.840.09-0.594-0.054
Passes1916.356.960.080.3810.03
Saves52.032.250.191.3170.25
Blocks175.914.130.112.6860.296
Takeaways103.352.920.112.2790.251

6.0 + clip(Σ 0.638 × 2, −3 to 3) = 7.276, then +0.3 blocks, −0.3 turnovers → 7.3

Pucker+125
StatValueLeague rateRatioWeightContribution
Goal contribution22.8380.7050.320.226
Shots23.6870.5430.080.043
Saves52.0322.4610.150.369
Blocks175.9122.8760.070.201
Takeaways103.3542.9820.120.358
Passes1916.3471.1620.080.093
Faceoff win rate0.40.50.7990.030.024

Σ 1.314 ÷ Σ weights 0.85 = 1.546 − 0.298 turnover penalty = 1.248 → ×100 = 124.76 → 125

Offensive4.64
RateValueLeagueWeightContribution
Points per possession-sec0.0270.0850.41.448
Shooting %0.50.450.21.288
Assists per pass0.0530.0770.41.907

Σ contribution = 4.643

Defensive9.49
StatValueLeague rated(ratio)WeightContribution
Saves52.0329.5910.32.877
Blocks175.9129.8160.21.963
Takeaways103.3549.8510.252.463
Goals conceded35.5258.7470.252.187

Σ contribution = 9.49

League average is 6.0 on Performance, Offensive and Defensive, and 100 on Pucker+. Every formula.

drewiou Tortola Hellcats

rated once over the whole game. Baseline: the player's own division.

Performance4.8
StatValueLeague avgStd devWeightzContribution
Goals01.661.580.23-1.049-0.241
Assists11.261.250.19-0.209-0.04
Shots23.692.840.09-0.594-0.054
Passes1416.356.960.08-0.337-0.027
Saves02.032.250.19-0.902-0.171
Blocks25.914.130.11-0.948-0.104
Takeaways73.352.920.111.250.138

6.0 + clip(Σ −0.499 × 2, −3 to 3) = 5.001, then −0.2 cold shooting → 4.8

Pucker+58
StatValueLeague rateRatioWeightContribution
Goal contribution12.8380.3520.320.113
Shots23.6870.5430.080.043
Saves02.03200.150
Blocks25.9120.3380.070.024
Takeaways73.3542.0870.120.25
Passes1416.3470.8560.080.069
Faceoff win rate10.51.9980.030.06

Σ 0.559 ÷ Σ weights 0.85 = 0.657 − 0.074 turnover penalty = 0.583 → ×100 = 58.31 → 58

Offensive4.38
RateValueLeagueWeightContribution
Points per possession-sec0.0310.0850.41.506
Shooting %00.450.20.591
Assists per pass0.0710.0770.42.28

Σ contribution = 4.377

Defensive5.52
StatValueLeague rated(ratio)WeightContribution
Saves02.0322.9540.30.886
Blocks25.9123.6820.20.736
Takeaways73.3549.1830.252.296
Goals conceded55.5256.4180.251.605

Σ contribution = 5.523

League average is 6.0 on Performance, Offensive and Defensive, and 100 on Pucker+. Every formula.

Himmy Butler Tortola Hellcats

rated once over the whole game. Baseline: the player's own division.

Performance5.6
StatValueLeague avgStd devWeightzContribution
Goals11.661.580.23-0.417-0.096
Assists01.261.250.19-1.006-0.191
Shots23.692.840.09-0.594-0.054
Passes1716.356.960.080.0940.008
Saves22.032.250.19-0.014-0.003
Blocks105.914.130.110.990.109
Takeaways83.352.920.111.5930.175

6.0 + clip(Σ −0.052 × 2, −3 to 3) = 5.897, then −0.3 turnovers → 5.6

Pucker+87
StatValueLeague rateRatioWeightContribution
Goal contribution12.8380.3520.320.113
Shots23.6870.5430.080.043
Saves22.0320.9840.150.148
Blocks105.9121.6910.070.118
Takeaways83.3542.3850.120.286
Passes1716.3471.040.080.083
Faceoff win rate0.750.51.4990.030.045

Σ 0.837 ÷ Σ weights 0.85 = 0.984 − 0.119 turnover penalty = 0.865 → ×100 = 86.52 → 87

Offensive3.84
RateValueLeagueWeightContribution
Points per possession-sec0.020.0850.41.375
Shooting %0.50.450.21.288
Assists per pass00.0770.41.181

Σ contribution = 3.845

Defensive7.45
StatValueLeague rated(ratio)WeightContribution
Saves22.0325.9380.31.781
Blocks105.9128.3960.21.679
Takeaways83.3549.5290.252.382
Goals conceded55.5256.4180.251.605

Σ contribution = 7.447

League average is 6.0 on Performance, Offensive and Defensive, and 100 on Pucker+. Every formula.

Buzzy Tortola Hellcats

rated once over the whole game. Baseline: the player's own division.

Performance5.7
StatValueLeague avgStd devWeightzContribution
Goals11.661.580.23-0.417-0.096
Assists11.261.250.19-0.209-0.04
Shots83.692.840.091.520.137
Passes2616.356.960.081.3860.111
Saves12.032.250.19-0.458-0.087
Blocks35.914.130.11-0.706-0.078
Takeaways83.352.920.111.5930.175

6.0 + clip(Σ 0.123 × 2, −3 to 3) = 6.246, then −0.3 turnovers, −0.2 cold shooting → 5.7

Pucker+92
StatValueLeague rateRatioWeightContribution
Goal contribution22.8380.7050.320.226
Shots83.6872.170.080.174
Saves12.0320.4920.150.074
Blocks35.9120.5070.070.036
Takeaways83.3542.3850.120.286
Passes2616.3471.5910.080.127
Faceoff win rate00.500.030

Σ 0.922 ÷ Σ weights 0.85 = 1.085 − 0.164 turnover penalty = 0.921 → ×100 = 92.07 → 92

Offensive4.23
RateValueLeagueWeightContribution
Points per possession-sec0.0560.0850.41.871
Shooting %0.1250.450.20.705
Assists per pass0.0380.0770.41.658

Σ contribution = 4.234

Defensive6.06
StatValueLeague rated(ratio)WeightContribution
Saves12.0324.1270.31.238
Blocks35.9124.1750.20.835
Takeaways83.3549.5290.252.382
Goals conceded55.5256.4180.251.605

Σ contribution = 6.06

League average is 6.0 on Performance, Offensive and Defensive, and 100 on Pucker+. Every formula.

DonJuan Tortola Hellcats

rated once over the whole game. Baseline: the player's own division.

Performance4.6
StatValueLeague avgStd devWeightzContribution
Goals11.661.580.23-0.417-0.096
Assists11.261.250.19-0.209-0.04
Shots33.692.840.09-0.242-0.022
Passes816.356.960.08-1.199-0.096
Saves02.032.250.19-0.902-0.171
Blocks25.914.130.11-0.948-0.104
Takeaways13.352.920.11-0.807-0.089

6.0 + clip(Σ −0.618 × 2, −3 to 3) = 4.765, then −0.2 cold shooting → 4.6

Pucker+46
StatValueLeague rateRatioWeightContribution
Goal contribution1.52.8380.5290.320.169
Shots33.6870.8140.080.065
Saves02.03200.150
Blocks25.9120.3380.070.024
Takeaways13.3540.2980.120.036
Passes816.3470.4890.080.039
Faceoff win rate10.51.9980.030.06

Σ 0.393 ÷ Σ weights 0.85 = 0.462 → ×100 = 46.21 → 46

Offensive7.76
RateValueLeagueWeightContribution
Points per possession-sec0.1540.0850.43.478
Shooting %0.3330.450.20.997
Assists per pass0.1250.0770.43.28

Σ contribution = 7.755

Defensive4.12
StatValueLeague rated(ratio)WeightContribution
Saves02.0322.9540.30.886
Blocks25.9123.6820.20.736
Takeaways13.3543.5780.250.894
Goals conceded55.5256.4180.251.605

Σ contribution = 4.121

League average is 6.0 on Performance, Offensive and Defensive, and 100 on Pucker+. Every formula.