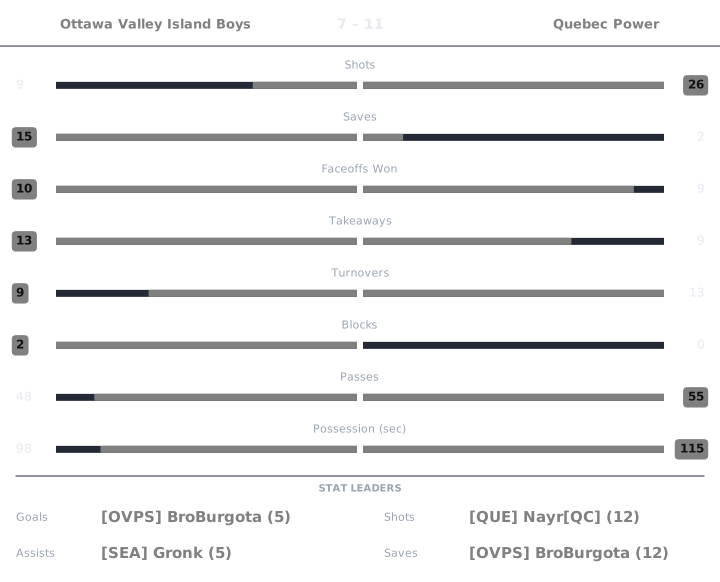
OVHomeOttawa Valley Island Boys
7–11Final
QPAwayQuebec Power

May 8, 2024 · Central B · The Island

MVP [OVPS] BroBurgota · 8.9 performance rating

Writing the recap…

Match box score chart

APR is the Alto Performance Rating: 0 to 10, with 6.0 league average. Click any APR to see the working.

Ottawa Valley Island Boys

PlayerGAPtsShotsSavesFOWFOLTKTOBlkPassesGWGPossAPRPucker+OffDef
[OVPD] NeedStaff / Jackie0220133221900:18586.864.85
[OVPS] BroBurgota5167123210402400:482155.967.17
[OVPS] EggsThink01102130111000:10435.404.81
[TRI] Slippin Johnny2022031120500:22405.253.49

Quebec Power

PlayerGAPtsShotsSavesFOWFOLTKTOBlkPassesGWGPossAPRPucker+OffDef
[QUE] Nayr[QC]549120442702200:251358.764.04
[SEA] Gronk45980214401701:031378.244.64
[SEA] wads22462353201600:27916.964.95

NeedStaff / Jackie Ottawa Valley Island Boys

rated once over the whole game. Baseline: the player's own division.

APR4.8
StatValueLeague avgStd devWeightzContribution
Goals01.891.840.23-1.027-0.236
Assists21.511.470.190.3360.064
Shots04.583.720.09-1.231-0.111
Passes916.167.330.08-0.976-0.078
Saves12.693.080.19-0.548-0.104
Blocks10.7410.110.2590.029
Takeaways23.22.820.11-0.426-0.047

6.0 + clip(Σ −0.484 × 2, −3 to 3) = 5.033, then −0.2 goals against → 4.8

Pucker+58
StatValueLeague rateRatioWeightContribution
Goal contribution23.2760.610.320.195
Shots04.57600.080
Saves12.6860.3720.150.056
Blocks10.7411.3490.070.094
Takeaways23.20.6250.120.075
Passes916.1570.5570.080.045
Faceoff win rate0.50.5010.9980.030.03

Σ 0.495 ÷ Σ weights 0.85 = 0.583 → ×100 = 58.25 → 58

Offensive6.86
RateValueLeagueWeightContribution
Points per possession-sec0.1110.1070.42.458
Shooting %00.4130.20.591
Assists per pass0.2220.0930.43.811

Σ contribution = 6.86

Defensive4.85
StatValueLeague rated(ratio)WeightContribution
Saves12.6863.7740.31.132
Blocks10.7417.3430.21.469
Takeaways23.24.5670.251.142
Goals conceded116.4084.4210.251.105

Σ contribution = 4.848

League average is 6.0 on APR, Offensive and Defensive, and 100 on Pucker+. Every formula.

BroBurgota Ottawa Valley Island Boys

rated once over the whole game. Baseline: the player's own division.

APR8.9
StatValueLeague avgStd devWeightzContribution
Goals51.891.840.231.6890.389
Assists11.511.470.19-0.344-0.065
Shots74.583.720.090.6520.059
Passes2416.167.330.081.070.086
Saves122.693.080.193.0260.575
Blocks00.7410.11-0.743-0.082
Takeaways103.22.820.112.4130.265

6.0 + clip(Σ 1.226 × 2, −3 to 3) = 8.452, then +0.35 saves, +0.25 hot shooting, −0.2 goals against → 8.9

Pucker+215
StatValueLeague rateRatioWeightContribution
Goal contribution5.53.2761.6790.320.537
Shots74.5761.530.080.122
Saves122.6864.4670.150.67
Blocks00.74100.070
Takeaways103.23.1250.120.375
Passes2416.1571.4850.080.119
Faceoff win rate0.60.5011.1980.030.036

Σ 1.859 ÷ Σ weights 0.85 = 2.187 − 0.038 turnover penalty = 2.149 → ×100 = 214.95 → 215

Offensive5.96
RateValueLeagueWeightContribution
Points per possession-sec0.1250.1070.42.663
Shooting %0.7140.4130.21.698
Assists per pass0.0420.0930.41.596

Σ contribution = 5.957

Defensive7.17
StatValueLeague rated(ratio)WeightContribution
Saves122.6869.9920.32.998
Blocks00.7412.9540.20.591
Takeaways103.29.8870.252.472
Goals conceded116.4084.4210.251.105

Σ contribution = 7.166

League average is 6.0 on APR, Offensive and Defensive, and 100 on Pucker+. Every formula.

EggsThink Ottawa Valley Island Boys

rated once over the whole game. Baseline: the player's own division.

APR4.6
StatValueLeague avgStd devWeightzContribution
Goals01.891.840.23-1.027-0.236
Assists11.511.470.19-0.344-0.065
Shots04.583.720.09-1.231-0.111
Passes1016.167.330.08-0.84-0.067
Saves22.693.080.19-0.223-0.042
Blocks10.7410.110.2590.029
Takeaways03.22.820.11-1.136-0.125

6.0 + clip(Σ −0.618 × 2, −3 to 3) = 4.763, then −0.2 goals against → 4.6

Pucker+43
StatValueLeague rateRatioWeightContribution
Goal contribution13.2760.3050.320.098
Shots04.57600.080
Saves22.6860.7450.150.112
Blocks10.7411.3490.070.094
Takeaways03.200.120
Passes1016.1570.6190.080.05
Faceoff win rate0.250.5010.4990.030.015

Σ 0.368 ÷ Σ weights 0.85 = 0.433 → ×100 = 43.33 → 43

Offensive5.40
RateValueLeagueWeightContribution
Points per possession-sec0.10.1070.42.292
Shooting %00.4130.20.591
Assists per pass0.10.0930.42.517

Σ contribution = 5.4

Defensive4.81
StatValueLeague rated(ratio)WeightContribution
Saves22.68650.31.5
Blocks10.7417.3430.21.469
Takeaways03.22.9540.250.738
Goals conceded116.4084.4210.251.105

Σ contribution = 4.812

League average is 6.0 on APR, Offensive and Defensive, and 100 on Pucker+. Every formula.

Slippin Johnny Ottawa Valley Island Boys

rated once over the whole game. Baseline: the player's own division.

APR4.7
StatValueLeague avgStd devWeightzContribution
Goals21.891.840.230.060.014
Assists01.511.470.19-1.025-0.195
Shots24.583.720.09-0.693-0.062
Passes516.167.330.08-1.522-0.122
Saves02.693.080.19-0.873-0.166
Blocks00.7410.11-0.743-0.082
Takeaways13.22.820.11-0.781-0.086

6.0 + clip(Σ −0.699 × 2, −3 to 3) = 4.603, then +0.25 hot shooting, −0.2 goals against → 4.7

Pucker+40
StatValueLeague rateRatioWeightContribution
Goal contribution23.2760.610.320.195
Shots24.5760.4370.080.035
Saves02.68600.150
Blocks00.74100.070
Takeaways13.20.3120.120.037
Passes516.1570.3090.080.025
Faceoff win rate0.750.5011.4970.030.045

Σ 0.337 ÷ Σ weights 0.85 = 0.397 → ×100 = 39.7 → 40

Offensive5.25
RateValueLeagueWeightContribution
Points per possession-sec0.0910.1070.42.159
Shooting %10.4130.21.912
Assists per pass00.0930.41.181

Σ contribution = 5.252

Defensive3.49
StatValueLeague rated(ratio)WeightContribution
Saves02.6862.9540.30.886
Blocks00.7412.9540.20.591
Takeaways13.23.6150.250.904
Goals conceded116.4084.4210.251.105

Σ contribution = 3.486

League average is 6.0 on APR, Offensive and Defensive, and 100 on Pucker+. Every formula.

Nayr[QC] Quebec Power

rated once over the whole game. Baseline: the player's own division.

APR7.0
StatValueLeague avgStd devWeightzContribution
Goals51.891.840.231.6890.389
Assists41.511.470.191.6980.323
Shots124.583.720.091.9970.18
Passes2216.167.330.080.7970.064
Saves02.693.080.19-0.873-0.166
Blocks00.7410.11-0.743-0.082
Takeaways23.22.820.11-0.426-0.047

6.0 + clip(Σ 0.66 × 2, −3 to 3) = 7.321, then −0.3 turnovers → 7.0

Pucker+135
StatValueLeague rateRatioWeightContribution
Goal contribution93.2762.7470.320.879
Shots124.5762.6220.080.21
Saves02.68600.150
Blocks00.74100.070
Takeaways23.20.6250.120.075
Passes2216.1571.3620.080.109
Faceoff win rate0.50.5010.9980.030.03

Σ 1.303 ÷ Σ weights 0.85 = 1.533 − 0.179 turnover penalty = 1.354 → ×100 = 135.36 → 135

Offensive8.76
RateValueLeagueWeightContribution
Points per possession-sec0.360.1070.43.972
Shooting %0.4170.4130.21.207
Assists per pass0.1820.0930.43.584

Σ contribution = 8.763

Defensive4.04
StatValueLeague rated(ratio)WeightContribution
Saves02.6862.9540.30.886
Blocks00.7412.9540.20.591
Takeaways23.24.5670.251.142
Goals conceded76.4085.6620.251.416

Σ contribution = 4.035

League average is 6.0 on APR, Offensive and Defensive, and 100 on Pucker+. Every formula.

Gronk Quebec Power

rated once over the whole game. Baseline: the player's own division.

APR7.6
StatValueLeague avgStd devWeightzContribution
Goals41.891.840.231.1460.264
Assists51.511.470.192.3790.452
Shots84.583.720.090.9210.083
Passes1716.167.330.080.1150.009
Saves02.693.080.19-0.873-0.166
Blocks00.7410.11-0.743-0.082
Takeaways43.22.820.110.2840.031

6.0 + clip(Σ 0.591 × 2, −3 to 3) = 7.183, then +0.4 playmaker → 7.6

Pucker+137
StatValueLeague rateRatioWeightContribution
Goal contribution83.2762.4420.320.781
Shots84.5761.7480.080.14
Saves02.68600.150
Blocks00.74100.070
Takeaways43.21.250.120.15
Passes1716.1571.0520.080.084
Faceoff win rate0.6670.5011.3310.030.04

Σ 1.195 ÷ Σ weights 0.85 = 1.406 − 0.038 turnover penalty = 1.368 → ×100 = 136.82 → 137

Offensive8.24
RateValueLeagueWeightContribution
Points per possession-sec0.1430.1070.42.913
Shooting %0.50.4130.21.366
Assists per pass0.2940.0930.43.958

Σ contribution = 8.237

Defensive4.64
StatValueLeague rated(ratio)WeightContribution
Saves02.6862.9540.30.886
Blocks00.7412.9540.20.591
Takeaways43.26.980.251.745
Goals conceded76.4085.6620.251.416

Σ contribution = 4.638

League average is 6.0 on APR, Offensive and Defensive, and 100 on Pucker+. Every formula.

wads Quebec Power

rated once over the whole game. Baseline: the player's own division.

APR5.8
StatValueLeague avgStd devWeightzContribution
Goals21.891.840.230.060.014
Assists21.511.470.190.3360.064
Shots64.583.720.090.3830.034
Passes1616.167.330.08-0.021-0.002
Saves22.693.080.19-0.223-0.042
Blocks00.7410.11-0.743-0.082
Takeaways33.22.820.11-0.071-0.008

6.0 + clip(Σ −0.021 × 2, −3 to 3) = 5.957, then −0.2 cold shooting → 5.8

Pucker+91
StatValueLeague rateRatioWeightContribution
Goal contribution3.53.2761.0680.320.342
Shots64.5761.3110.080.105
Saves22.6860.7450.150.112
Blocks00.74100.070
Takeaways33.20.9380.120.112
Passes1616.1570.990.080.079
Faceoff win rate0.3750.5010.7490.030.022

Σ 0.773 ÷ Σ weights 0.85 = 0.909 → ×100 = 90.89 → 91

Offensive6.96
RateValueLeagueWeightContribution
Points per possession-sec0.1480.1070.42.983
Shooting %0.3330.4130.21.048
Assists per pass0.1250.0930.42.926

Σ contribution = 6.956

Defensive4.95
StatValueLeague rated(ratio)WeightContribution
Saves22.68650.31.5
Blocks00.7412.9540.20.591
Takeaways33.25.750.251.438
Goals conceded76.4085.6620.251.416

Σ contribution = 4.945

League average is 6.0 on APR, Offensive and Defensive, and 100 on Pucker+. Every formula.