QPHomeQuebec Power
12–5Final
OVAwayOttawa Valley Island Boys

Jun 3, 2024 · Central B · Nayr Arena

MVP [SEA] Gronk · 7.8 performance rating

Writing the recap…

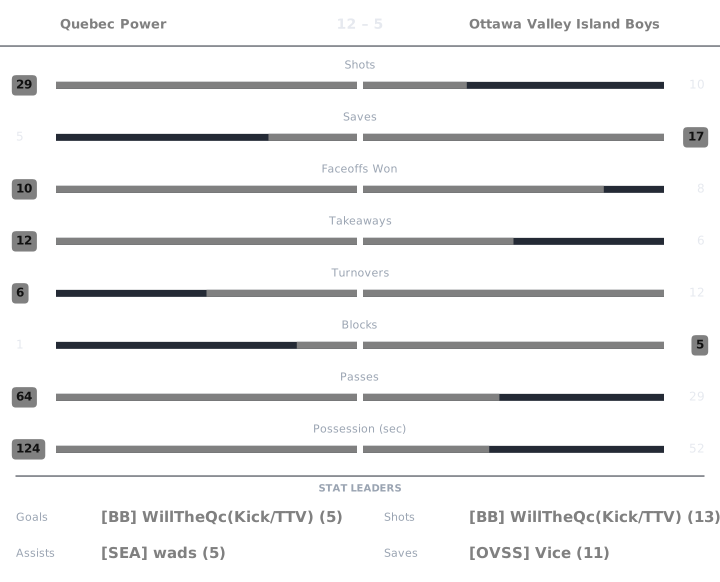
Match box score chart

Perf is a 0 to 10 Alto rating, 6.0 being league average. Click any Perf number to see the working behind it.

Quebec Power

PlayerGAPtsShotsSavesFOWFOLTKTOBlkPassesGWGPossPerfPucker+OffDef
[BB] WillTheQc(Kick/TTV)538131113012200:221548.215.81
[SEA] Gronk54964324301701:121628.336.45
[SEA] wads257100655302500:301418.255.26

Ottawa Valley Island Boys

PlayerGAPtsShotsSavesFOWFOLTKTOBlkPassesGWGPossPerfPucker+OffDef
[DCU] kman3143012031600:04699.364.16
[OVPS] EggsThink0001222042600:12412.955.25
[OVSS] Vice02221134332600:181417.037.45
[TRI] Slippin Johnny20244223201100:18815.015.44

WillTheQc(Kick/TTV) Quebec Power

rated once over the whole game. Baseline: the player's own division.

Performance7.3
StatValueLeague avgStd devWeightzContribution
Goals51.891.840.231.6890.389
Assists31.511.470.191.0170.193
Shots134.583.720.092.2670.204
Passes2216.167.330.080.7970.064
Saves12.693.080.19-0.548-0.104
Blocks10.7410.110.2590.029
Takeaways33.22.820.11-0.071-0.008

6.0 + clip(Σ 0.766 × 2, −3 to 3) = 7.532, then −0.2 cold shooting → 7.3

Pucker+154
StatValueLeague rateRatioWeightContribution
Goal contribution73.2762.1360.320.684
Shots134.5762.8410.080.227
Saves12.6860.3720.150.056
Blocks10.7411.3490.070.094
Takeaways33.20.9380.120.112
Passes2216.1571.3620.080.109
Faceoff win rate0.50.5010.9980.030.03

Σ 1.313 ÷ Σ weights 0.85 = 1.544 → ×100 = 154.42 → 154

Offensive8.21
RateValueLeagueWeightContribution
Points per possession-sec0.3640.1070.43.973
Shooting %0.3850.4130.21.145
Assists per pass0.1360.0930.43.092

Σ contribution = 8.211

Defensive5.81
StatValueLeague rated(ratio)WeightContribution
Saves12.6863.7740.31.132
Blocks10.7417.3430.21.469
Takeaways33.25.750.251.438
Goals conceded56.4087.0970.251.774

Σ contribution = 5.813

League average is 6.0 on Performance, Offensive and Defensive, and 100 on Pucker+. Every formula.

Gronk Quebec Power

rated once over the whole game. Baseline: the player's own division.

Performance7.8
StatValueLeague avgStd devWeightzContribution
Goals51.891.840.231.6890.389
Assists41.511.470.191.6980.323
Shots64.583.720.090.3830.034
Passes1716.167.330.080.1150.009
Saves42.693.080.190.4270.081
Blocks00.7410.11-0.743-0.082
Takeaways43.22.820.110.2840.031

6.0 + clip(Σ 0.785 × 2, −3 to 3) = 7.571, then +0.25 hot shooting → 7.8

Pucker+162
StatValueLeague rateRatioWeightContribution
Goal contribution83.2762.4420.320.781
Shots64.5761.3110.080.105
Saves42.6861.4890.150.223
Blocks00.74100.070
Takeaways43.21.250.120.15
Passes1716.1571.0520.080.084
Faceoff win rate0.60.5011.1980.030.036

Σ 1.38 ÷ Σ weights 0.85 = 1.623 → ×100 = 162.32 → 162

Offensive8.33
RateValueLeagueWeightContribution
Points per possession-sec0.1250.1070.42.663
Shooting %0.8330.4130.21.815
Assists per pass0.2350.0930.43.855

Σ contribution = 8.333

Defensive6.45
StatValueLeague rated(ratio)WeightContribution
Saves42.6867.8140.32.344
Blocks00.7412.9540.20.591
Takeaways43.26.980.251.745
Goals conceded56.4087.0970.251.774

Σ contribution = 6.454

League average is 6.0 on Performance, Offensive and Defensive, and 100 on Pucker+. Every formula.

wads Quebec Power

rated once over the whole game. Baseline: the player's own division.

Performance7.2
StatValueLeague avgStd devWeightzContribution
Goals21.891.840.230.060.014
Assists51.511.470.192.3790.452
Shots104.583.720.091.4590.131
Passes2516.167.330.081.2060.097
Saves02.693.080.19-0.873-0.166
Blocks00.7410.11-0.743-0.082
Takeaways53.22.820.110.6390.07

6.0 + clip(Σ 0.516 × 2, −3 to 3) = 7.033, then +0.4 playmaker, −0.2 cold shooting → 7.2

Pucker+141
StatValueLeague rateRatioWeightContribution
Goal contribution73.2762.1360.320.684
Shots104.5762.1850.080.175
Saves02.68600.150
Blocks00.74100.070
Takeaways53.21.5620.120.188
Passes2516.1571.5470.080.124
Faceoff win rate0.5450.5011.0890.030.033

Σ 1.202 ÷ Σ weights 0.85 = 1.415 → ×100 = 141.46 → 141

Offensive8.25
RateValueLeagueWeightContribution
Points per possession-sec0.2330.1070.43.722
Shooting %0.20.4130.20.821
Assists per pass0.20.0930.43.706

Σ contribution = 8.249

Defensive5.26
StatValueLeague rated(ratio)WeightContribution
Saves02.6862.9540.30.886
Blocks00.7412.9540.20.591
Takeaways53.28.0390.252.01
Goals conceded56.4087.0970.251.774

Σ contribution = 5.261

League average is 6.0 on Performance, Offensive and Defensive, and 100 on Pucker+. Every formula.

kman Ottawa Valley Island Boys

rated once over the whole game. Baseline: the player's own division.

Performance5.4
StatValueLeague avgStd devWeightzContribution
Goals31.891.840.230.6030.139
Assists11.511.470.19-0.344-0.065
Shots34.583.720.09-0.424-0.038
Passes616.167.330.08-1.386-0.111
Saves02.693.080.19-0.873-0.166
Blocks10.7410.110.2590.029
Takeaways03.22.820.11-1.136-0.125

6.0 + clip(Σ −0.338 × 2, −3 to 3) = 5.324, then +0.25 hot shooting, −0.2 goals against → 5.4

Pucker+69
StatValueLeague rateRatioWeightContribution
Goal contribution43.2761.2210.320.391
Shots34.5760.6560.080.052
Saves02.68600.150
Blocks10.7411.3490.070.094
Takeaways03.200.120
Passes616.1570.3710.080.03
Faceoff win rate0.3330.5010.6650.030.02

Σ 0.587 ÷ Σ weights 0.85 = 0.691 → ×100 = 69.09 → 69

Offensive9.36
RateValueLeagueWeightContribution
Points per possession-sec10.1070.44
Shooting %10.4130.21.912
Assists per pass0.1670.0930.43.452

Σ contribution = 9.364

Defensive4.16
StatValueLeague rated(ratio)WeightContribution
Saves02.6862.9540.30.886
Blocks10.7417.3430.21.469
Takeaways03.22.9540.250.738
Goals conceded126.4084.260.251.065

Σ contribution = 4.158

League average is 6.0 on Performance, Offensive and Defensive, and 100 on Pucker+. Every formula.

EggsThink Ottawa Valley Island Boys

rated once over the whole game. Baseline: the player's own division.

Performance4.3
StatValueLeague avgStd devWeightzContribution
Goals01.891.840.23-1.027-0.236
Assists01.511.470.19-1.025-0.195
Shots14.583.720.09-0.962-0.087
Passes616.167.330.08-1.386-0.111
Saves22.693.080.19-0.223-0.042
Blocks20.7410.111.2620.139
Takeaways03.22.820.11-1.136-0.125

6.0 + clip(Σ −0.657 × 2, −3 to 3) = 4.686, then −0.2 cold shooting, −0.2 goals against → 4.3

Pucker+41
StatValueLeague rateRatioWeightContribution
Goal contribution03.27600.320
Shots14.5760.2190.080.017
Saves22.6860.7450.150.112
Blocks20.7412.6980.070.189
Takeaways03.200.120
Passes616.1570.3710.080.03
Faceoff win rate0.50.5010.9980.030.03

Σ 0.378 ÷ Σ weights 0.85 = 0.444 − 0.038 turnover penalty = 0.406 → ×100 = 40.64 → 41

Offensive2.95
RateValueLeagueWeightContribution
Points per possession-sec00.1070.41.181
Shooting %00.4130.20.591
Assists per pass00.0930.41.181

Σ contribution = 2.954

Defensive5.25
StatValueLeague rated(ratio)WeightContribution
Saves22.68650.31.5
Blocks20.7419.7410.21.948
Takeaways03.22.9540.250.738
Goals conceded126.4084.260.251.065

Σ contribution = 5.251

League average is 6.0 on Performance, Offensive and Defensive, and 100 on Pucker+. Every formula.

Vice Ottawa Valley Island Boys

rated once over the whole game. Baseline: the player's own division.

Performance6.5
StatValueLeague avgStd devWeightzContribution
Goals01.891.840.23-1.027-0.236
Assists21.511.470.190.3360.064
Shots24.583.720.09-0.693-0.062
Passes616.167.330.08-1.386-0.111
Saves112.693.080.192.7010.513
Blocks20.7410.111.2620.139
Takeaways33.22.820.11-0.071-0.008

6.0 + clip(Σ 0.299 × 2, −3 to 3) = 6.597, then +0.35 saves, −0.2 cold shooting, −0.2 goals against → 6.5

Pucker+141
StatValueLeague rateRatioWeightContribution
Goal contribution23.2760.610.320.195
Shots24.5760.4370.080.035
Saves112.6864.0950.150.614
Blocks20.7412.6980.070.189
Takeaways33.20.9380.120.112
Passes616.1570.3710.080.03
Faceoff win rate0.4290.5010.8560.030.026

Σ 1.201 ÷ Σ weights 0.85 = 1.413 → ×100 = 141.33 → 141

Offensive7.03
RateValueLeagueWeightContribution
Points per possession-sec0.1110.1070.42.458
Shooting %00.4130.20.591
Assists per pass0.3330.0930.43.982

Σ contribution = 7.03

Defensive7.45
StatValueLeague rated(ratio)WeightContribution
Saves112.6869.9840.32.995
Blocks20.7419.7410.21.948
Takeaways33.25.750.251.438
Goals conceded126.4084.260.251.065

Σ contribution = 7.446

League average is 6.0 on Performance, Offensive and Defensive, and 100 on Pucker+. Every formula.

Slippin Johnny Ottawa Valley Island Boys

rated once over the whole game. Baseline: the player's own division.

Performance5.3
StatValueLeague avgStd devWeightzContribution
Goals21.891.840.230.060.014
Assists01.511.470.19-1.025-0.195
Shots44.583.720.09-0.155-0.014
Passes1116.167.330.08-0.704-0.056
Saves42.693.080.190.4270.081
Blocks00.7410.11-0.743-0.082
Takeaways33.22.820.11-0.071-0.008

6.0 + clip(Σ −0.26 × 2, −3 to 3) = 5.48, then −0.2 goals against → 5.3

Pucker+81
StatValueLeague rateRatioWeightContribution
Goal contribution23.2760.610.320.195
Shots44.5760.8740.080.07
Saves42.6861.4890.150.223
Blocks00.74100.070
Takeaways33.20.9380.120.112
Passes1116.1570.6810.080.054
Faceoff win rate0.50.5010.9980.030.03

Σ 0.686 ÷ Σ weights 0.85 = 0.806 → ×100 = 80.65 → 81

Offensive5.01
RateValueLeagueWeightContribution
Points per possession-sec0.1110.1070.42.458
Shooting %0.50.4130.21.366
Assists per pass00.0930.41.181

Σ contribution = 5.005

Defensive5.44
StatValueLeague rated(ratio)WeightContribution
Saves42.6867.8140.32.344
Blocks00.7412.9540.20.591
Takeaways33.25.750.251.438
Goals conceded126.4084.260.251.065

Σ contribution = 5.438

League average is 6.0 on Performance, Offensive and Defensive, and 100 on Pucker+. Every formula.