DDHomeDetroit Dingleberries
8–4Final
OVAwayOttawa Valley Island Boys

Apr 29, 2024 · Central B · The Angry Orchard

MVP [DD] $not · 7.6 performance rating

Writing the recap…

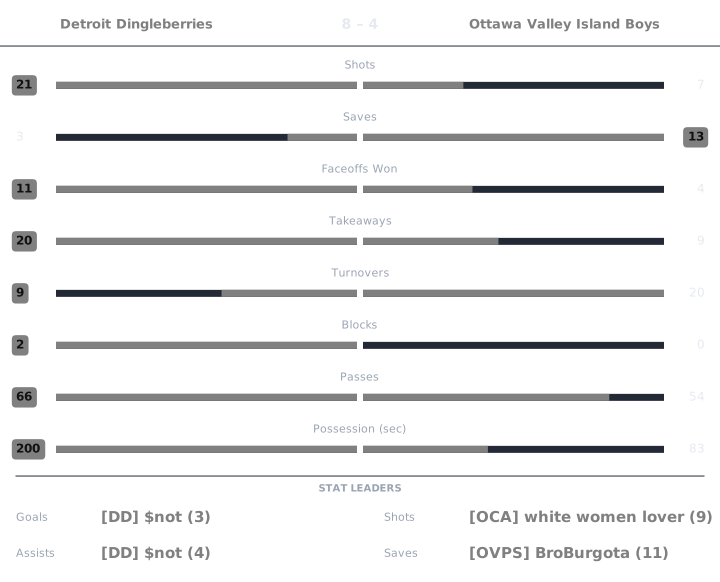
Match box score chart

Perf is a 0 to 10 Alto rating, 6.0 being league average. Click any Perf number to see the working behind it.

Detroit Dingleberries

PlayerGAPtsShotsSavesFOWFOLTKTOBlkPassesGWGPossPerfPucker+OffDef
[DD] $not34763517221801:491706.978.26
[OCA] white women lover34790117402101:011427.215.84
[WCW] CoBro21360526302700:30944.885.72

Ottawa Valley Island Boys

PlayerGAPtsShotsSavesFOWFOLTKTOBlkPassesGWGPossPerfPucker+OffDef
[OVPD] NeedStaff / Jackie0000000040300:0202.953.52
[OVPS] BroBurgota2134110591101400:581265.047.34
[OVPS] EggsThink10110130101900:02267.093.52
[TRI] Slippin Johnny10122330401800:21394.144.13

$not Detroit Dingleberries

rated once over the whole game. Baseline: the player's own division.

Performance7.6
StatValueLeague avgStd devWeightzContribution
Goals31.891.840.230.6030.139
Assists41.511.470.191.6980.323
Shots64.583.720.090.3830.034
Passes1816.167.330.080.2510.02
Saves32.693.080.190.1020.019
Blocks20.7410.111.2620.139
Takeaways73.22.820.111.3490.148

6.0 + clip(Σ 0.822 × 2, −3 to 3) = 7.645, nothing hit the bonus or penalty thresholds → 7.6

Pucker+170
StatValueLeague rateRatioWeightContribution
Goal contribution63.2761.8310.320.586
Shots64.5761.3110.080.105
Saves32.6861.1170.150.168
Blocks20.7412.6980.070.189
Takeaways73.22.1880.120.263
Passes1816.1571.1140.080.089
Faceoff win rate0.8330.5011.6640.030.05

Σ 1.449 ÷ Σ weights 0.85 = 1.704 → ×100 = 170.45 → 170

Offensive6.97
RateValueLeagueWeightContribution
Points per possession-sec0.0640.1070.41.791
Shooting %0.50.4130.21.366
Assists per pass0.2220.0930.43.811

Σ contribution = 6.968

Defensive8.26
StatValueLeague rated(ratio)WeightContribution
Saves32.6866.4650.31.94
Blocks20.7419.7410.21.948
Takeaways73.29.3190.252.33
Goals conceded46.4088.1540.252.038

Σ contribution = 8.256

League average is 6.0 on Performance, Offensive and Defensive, and 100 on Pucker+. Every formula.

white women lover Detroit Dingleberries

rated once over the whole game. Baseline: the player's own division.

Performance6.8
StatValueLeague avgStd devWeightzContribution
Goals31.891.840.230.6030.139
Assists41.511.470.191.6980.323
Shots94.583.720.091.190.107
Passes2116.167.330.080.6610.053
Saves02.693.080.19-0.873-0.166
Blocks00.7410.11-0.743-0.082
Takeaways73.22.820.111.3490.148

6.0 + clip(Σ 0.522 × 2, −3 to 3) = 7.044, then −0.2 cold shooting → 6.8

Pucker+142
StatValueLeague rateRatioWeightContribution
Goal contribution73.2762.1360.320.684
Shots94.5761.9670.080.157
Saves02.68600.150
Blocks00.74100.070
Takeaways73.22.1880.120.263
Passes2116.1571.30.080.104
Faceoff win rate0.50.5010.9980.030.03

Σ 1.237 ÷ Σ weights 0.85 = 1.456 − 0.038 turnover penalty = 1.418 → ×100 = 141.78 → 142

Offensive7.21
RateValueLeagueWeightContribution
Points per possession-sec0.1150.1070.42.512
Shooting %0.3330.4130.21.048
Assists per pass0.190.0930.43.647

Σ contribution = 7.207

Defensive5.84
StatValueLeague rated(ratio)WeightContribution
Saves02.6862.9540.30.886
Blocks00.7412.9540.20.591
Takeaways73.29.3190.252.33
Goals conceded46.4088.1540.252.038

Σ contribution = 5.845

League average is 6.0 on Performance, Offensive and Defensive, and 100 on Pucker+. Every formula.

CoBro Detroit Dingleberries

rated once over the whole game. Baseline: the player's own division.

Performance5.7
StatValueLeague avgStd devWeightzContribution
Goals21.891.840.230.060.014
Assists11.511.470.19-0.344-0.065
Shots64.583.720.090.3830.034
Passes2716.167.330.081.4790.118
Saves02.693.080.19-0.873-0.166
Blocks00.7410.11-0.743-0.082
Takeaways63.22.820.110.9940.109

6.0 + clip(Σ −0.037 × 2, −3 to 3) = 5.926, then −0.2 cold shooting → 5.7

Pucker+94
StatValueLeague rateRatioWeightContribution
Goal contribution33.2760.9160.320.293
Shots64.5761.3110.080.105
Saves02.68600.150
Blocks00.74100.070
Takeaways63.21.8750.120.225
Passes2716.1571.6710.080.134
Faceoff win rate0.7140.5011.4260.030.043

Σ 0.799 ÷ Σ weights 0.85 = 0.94 → ×100 = 94.04 → 94

Offensive4.88
RateValueLeagueWeightContribution
Points per possession-sec0.10.1070.42.292
Shooting %0.3330.4130.21.048
Assists per pass0.0370.0930.41.538

Σ contribution = 4.878

Defensive5.72
StatValueLeague rated(ratio)WeightContribution
Saves02.6862.9540.30.886
Blocks00.7412.9540.20.591
Takeaways63.28.8160.252.204
Goals conceded46.4088.1540.252.038

Σ contribution = 5.719

League average is 6.0 on Performance, Offensive and Defensive, and 100 on Pucker+. Every formula.

NeedStaff / Jackie Ottawa Valley Island Boys

rated once over the whole game. Baseline: the player's own division.

Performance3.7
StatValueLeague avgStd devWeightzContribution
Goals01.891.840.23-1.027-0.236
Assists01.511.470.19-1.025-0.195
Shots04.583.720.09-1.231-0.111
Passes316.167.330.08-1.795-0.144
Saves02.693.080.19-0.873-0.166
Blocks00.7410.11-0.743-0.082
Takeaways03.22.820.11-1.136-0.125

6.0 + clip(Σ −1.058 × 2, −3 to 3) = 3.884, then −0.2 goals against → 3.7

Pucker+0
StatValueLeague rateRatioWeightContribution
Goal contribution03.27600.320
Shots04.57600.080
Saves02.68600.150
Blocks00.74100.070
Takeaways03.200.120
Passes316.1570.1860.080.015
Faceoff win rate00.50100.030

Σ 0.015 ÷ Σ weights 0.85 = 0.017 − 0.038 turnover penalty = −0.021 → ×100 = 0 → 0

Offensive2.95
RateValueLeagueWeightContribution
Points per possession-sec00.1070.41.181
Shooting %00.4130.20.591
Assists per pass00.0930.41.181

Σ contribution = 2.954

Defensive3.52
StatValueLeague rated(ratio)WeightContribution
Saves02.6862.9540.30.886
Blocks00.7412.9540.20.591
Takeaways03.22.9540.250.738
Goals conceded86.4085.2140.251.304

Σ contribution = 3.519

League average is 6.0 on Performance, Offensive and Defensive, and 100 on Pucker+. Every formula.

BroBurgota Ottawa Valley Island Boys

rated once over the whole game. Baseline: the player's own division.

Performance7.0
StatValueLeague avgStd devWeightzContribution
Goals21.891.840.230.060.014
Assists11.511.470.19-0.344-0.065
Shots44.583.720.09-0.155-0.014
Passes1416.167.330.08-0.294-0.024
Saves112.693.080.192.7010.513
Blocks00.7410.11-0.743-0.082
Takeaways93.22.820.112.0580.226

6.0 + clip(Σ 0.569 × 2, −3 to 3) = 7.137, then +0.35 saves, −0.3 turnovers, −0.2 goals against → 7.0

Pucker+126
StatValueLeague rateRatioWeightContribution
Goal contribution33.2760.9160.320.293
Shots44.5760.8740.080.07
Saves112.6864.0950.150.614
Blocks00.74100.070
Takeaways93.22.8120.120.337
Passes1416.1570.8670.080.069
Faceoff win rate00.50100.030

Σ 1.384 ÷ Σ weights 0.85 = 1.628 − 0.367 turnover penalty = 1.261 → ×100 = 126.13 → 126

Offensive5.04
RateValueLeagueWeightContribution
Points per possession-sec0.0520.1070.41.639
Shooting %0.50.4130.21.366
Assists per pass0.0710.0930.42.033

Σ contribution = 5.037

Defensive7.34
StatValueLeague rated(ratio)WeightContribution
Saves112.6869.9840.32.995
Blocks00.7412.9540.20.591
Takeaways93.29.7920.252.448
Goals conceded86.4085.2140.251.304

Σ contribution = 7.338

League average is 6.0 on Performance, Offensive and Defensive, and 100 on Pucker+. Every formula.

EggsThink Ottawa Valley Island Boys

rated once over the whole game. Baseline: the player's own division.

Performance4.6
StatValueLeague avgStd devWeightzContribution
Goals11.891.840.23-0.484-0.111
Assists01.511.470.19-1.025-0.195
Shots14.583.720.09-0.962-0.087
Passes1916.167.330.080.3880.031
Saves02.693.080.19-0.873-0.166
Blocks00.7410.11-0.743-0.082
Takeaways03.22.820.11-1.136-0.125

6.0 + clip(Σ −0.734 × 2, −3 to 3) = 4.532, then +0.25 hot shooting, −0.2 goals against → 4.6

Pucker+26
StatValueLeague rateRatioWeightContribution
Goal contribution13.2760.3050.320.098
Shots14.5760.2190.080.017
Saves02.68600.150
Blocks00.74100.070
Takeaways03.200.120
Passes1916.1571.1760.080.094
Faceoff win rate0.250.5010.4990.030.015

Σ 0.224 ÷ Σ weights 0.85 = 0.264 → ×100 = 26.38 → 26

Offensive7.09
RateValueLeagueWeightContribution
Points per possession-sec0.50.1070.43.998
Shooting %10.4130.21.912
Assists per pass00.0930.41.181

Σ contribution = 7.091

Defensive3.52
StatValueLeague rated(ratio)WeightContribution
Saves02.6862.9540.30.886
Blocks00.7412.9540.20.591
Takeaways03.22.9540.250.738
Goals conceded86.4085.2140.251.304

Σ contribution = 3.519

League average is 6.0 on Performance, Offensive and Defensive, and 100 on Pucker+. Every formula.

Slippin Johnny Ottawa Valley Island Boys

rated once over the whole game. Baseline: the player's own division.

Performance4.6
StatValueLeague avgStd devWeightzContribution
Goals11.891.840.23-0.484-0.111
Assists01.511.470.19-1.025-0.195
Shots24.583.720.09-0.693-0.062
Passes1816.167.330.080.2510.02
Saves22.693.080.19-0.223-0.042
Blocks00.7410.11-0.743-0.082
Takeaways03.22.820.11-1.136-0.125

6.0 + clip(Σ −0.597 × 2, −3 to 3) = 4.805, then −0.2 goals against → 4.6

Pucker+39
StatValueLeague rateRatioWeightContribution
Goal contribution13.2760.3050.320.098
Shots24.5760.4370.080.035
Saves22.6860.7450.150.112
Blocks00.74100.070
Takeaways03.200.120
Passes1816.1571.1140.080.089
Faceoff win rate0.50.5010.9980.030.03

Σ 0.363 ÷ Σ weights 0.85 = 0.428 − 0.038 turnover penalty = 0.39 → ×100 = 38.95 → 39

Offensive4.14
RateValueLeagueWeightContribution
Points per possession-sec0.0480.1070.41.592
Shooting %0.50.4130.21.366
Assists per pass00.0930.41.181

Σ contribution = 4.14

Defensive4.13
StatValueLeague rated(ratio)WeightContribution
Saves22.68650.31.5
Blocks00.7412.9540.20.591
Takeaways03.22.9540.250.738
Goals conceded86.4085.2140.251.304

Σ contribution = 4.133

League average is 6.0 on Performance, Offensive and Defensive, and 100 on Pucker+. Every formula.