OCHomeOregon Capybaras - west
2–11Final
PPAwayProvo Polar Bears

Apr 1, 2024 · Pacific Cup - Playoffs · Moda Center

MVP [LIL] Blue · 7.7 performance rating

Writing the recap…

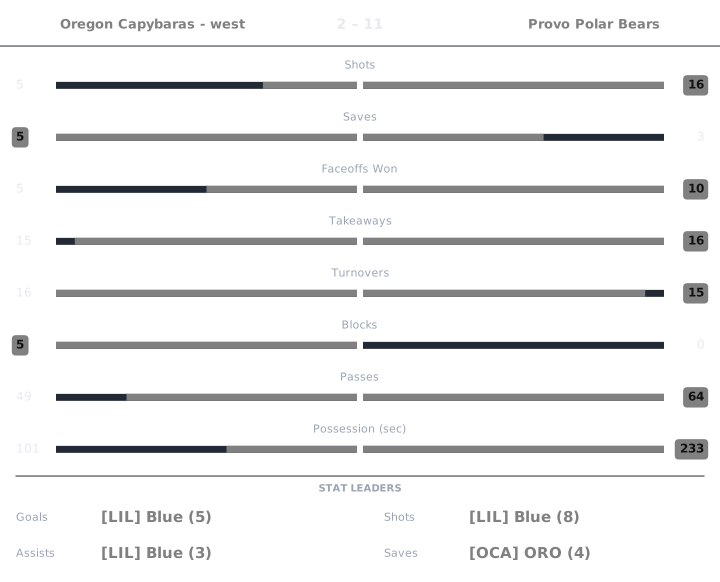
Match box score chart

Perf is a 0 to 10 Alto rating, 6.0 being league average. Click any Perf number to see the working behind it.

Oregon Capybaras - west

PlayerGAPtsShotsSavesFOWFOLTKTOBlkPassesGWGPossPerfPucker+OffDef
[OCA] Carried by Dad01120144401700:19374.343.99
[OCA] Curt20221135502400:35584.984.49
[OCA] ORO0111433675800:471005.057.39

Provo Polar Bears

PlayerGAPtsShotsSavesFOWFOLTKTOBlkPassesGWGPossPerfPucker+OffDef
[LIL] Blue53882009402802:461546.056.70
[MMM] SoccerboyEJ33631725701500:47938.865.66
[PRO] Chaser31450332402100:20717.024.75

Carried by Dad Oregon Capybaras - west

rated once over the whole game. Baseline: the player's own division.

Performance4.2
StatValueLeague avgStd devWeightzContribution
Goals02.051.810.23-1.134-0.261
Assists11.771.610.19-0.477-0.091
Shots24.633.240.09-0.812-0.073
Passes1720.458.530.08-0.404-0.032
Saves02.513.170.19-0.793-0.151
Blocks00.971.170.11-0.831-0.091
Takeaways44.353.540.11-0.098-0.011

6.0 + clip(Σ −0.71 × 2, −3 to 3) = 4.58, then −0.2 cold shooting, −0.2 goals against → 4.2

Pucker+37
StatValueLeague rateRatioWeightContribution
Goal contribution13.6730.2720.320.087
Shots24.6280.4320.080.035
Saves02.51300.150
Blocks00.97400.070
Takeaways44.3460.920.120.11
Passes1720.4490.8310.080.067
Faceoff win rate0.20.5050.3960.030.012

Σ 0.311 ÷ Σ weights 0.85 = 0.365 → ×100 = 36.53 → 37

Offensive4.34
RateValueLeagueWeightContribution
Points per possession-sec0.0530.0830.41.843
Shooting %00.4430.20.591
Assists per pass0.0590.0870.41.905

Σ contribution = 4.338

Defensive3.99
StatValueLeague rated(ratio)WeightContribution
Saves02.5132.9540.30.886
Blocks00.9742.9540.20.591
Takeaways44.3465.6820.251.421
Goals conceded116.2694.3780.251.095

Σ contribution = 3.993

League average is 6.0 on Performance, Offensive and Defensive, and 100 on Pucker+. Every formula.

Curt Oregon Capybaras - west

rated once over the whole game. Baseline: the player's own division.

Performance5.2
StatValueLeague avgStd devWeightzContribution
Goals22.051.810.23-0.028-0.007
Assists01.771.610.19-1.098-0.209
Shots24.633.240.09-0.812-0.073
Passes2420.458.530.080.4160.033
Saves12.513.170.19-0.477-0.091
Blocks00.971.170.11-0.831-0.091
Takeaways54.353.540.110.1850.02

6.0 + clip(Σ −0.417 × 2, −3 to 3) = 5.167, then +0.25 hot shooting, −0.2 goals against → 5.2

Pucker+58
StatValueLeague rateRatioWeightContribution
Goal contribution23.6730.5450.320.174
Shots24.6280.4320.080.035
Saves12.5130.3980.150.06
Blocks00.97400.070
Takeaways54.3461.150.120.138
Passes2420.4491.1740.080.094
Faceoff win rate0.250.5050.4950.030.015

Σ 0.515 ÷ Σ weights 0.85 = 0.606 − 0.027 turnover penalty = 0.579 → ×100 = 57.95 → 58

Offensive4.98
RateValueLeagueWeightContribution
Points per possession-sec0.0570.0830.41.921
Shooting %10.4430.21.88
Assists per pass00.0870.41.181

Σ contribution = 4.983

Defensive4.49
StatValueLeague rated(ratio)WeightContribution
Saves12.5133.8460.31.154
Blocks00.9742.9540.20.591
Takeaways54.3466.5970.251.649
Goals conceded116.2694.3780.251.095

Σ contribution = 4.489

League average is 6.0 on Performance, Offensive and Defensive, and 100 on Pucker+. Every formula.

ORO Oregon Capybaras - west

rated once over the whole game. Baseline: the player's own division.

Performance5.2
StatValueLeague avgStd devWeightzContribution
Goals02.051.810.23-1.134-0.261
Assists11.771.610.19-0.477-0.091
Shots14.633.240.09-1.121-0.101
Passes820.458.530.08-1.46-0.117
Saves42.513.170.190.4690.089
Blocks50.971.170.113.4320.378
Takeaways64.353.540.110.4670.051

6.0 + clip(Σ −0.051 × 2, −3 to 3) = 5.897, then −0.3 turnovers, −0.2 cold shooting, −0.2 goals against → 5.2

Pucker+100
StatValueLeague rateRatioWeightContribution
Goal contribution13.6730.2720.320.087
Shots14.6280.2160.080.017
Saves42.5131.5920.150.239
Blocks50.9745.1320.070.359
Takeaways64.3461.3810.120.166
Passes820.4490.3910.080.031
Faceoff win rate0.50.5050.9890.030.03

Σ 0.929 ÷ Σ weights 0.85 = 1.093 − 0.097 turnover penalty = 0.996 → ×100 = 99.56 → 100

Offensive5.05
RateValueLeagueWeightContribution
Points per possession-sec0.0210.0830.41.391
Shooting %00.4430.20.591
Assists per pass0.1250.0870.43.068

Σ contribution = 5.05

Defensive7.39
StatValueLeague rated(ratio)WeightContribution
Saves42.5138.1250.32.437
Blocks50.9749.9980.22
Takeaways64.3467.4530.251.863
Goals conceded116.2694.3780.251.095

Σ contribution = 7.395

League average is 6.0 on Performance, Offensive and Defensive, and 100 on Pucker+. Every formula.

Blue Provo Polar Bears

rated once over the whole game. Baseline: the player's own division.

Performance7.7
StatValueLeague avgStd devWeightzContribution
Goals52.051.810.231.6310.375
Assists31.771.610.190.7640.145
Shots84.633.240.091.0420.094
Passes2820.458.530.080.8860.071
Saves22.513.170.19-0.162-0.031
Blocks00.971.170.11-0.831-0.091
Takeaways94.353.540.111.3140.145

6.0 + clip(Σ 0.707 × 2, −3 to 3) = 7.415, then +0.25 hot shooting → 7.7

Pucker+154
StatValueLeague rateRatioWeightContribution
Goal contribution83.6732.1780.320.697
Shots84.6281.7290.080.138
Saves22.5130.7960.150.119
Blocks00.97400.070
Takeaways94.3462.0710.120.248
Passes2820.4491.3690.080.11
Faceoff win rate00.50500.030

Σ 1.313 ÷ Σ weights 0.85 = 1.544 → ×100 = 154.43 → 154

Offensive6.05
RateValueLeagueWeightContribution
Points per possession-sec0.0480.0830.41.769
Shooting %0.6250.4430.21.511
Assists per pass0.1070.0870.42.774

Σ contribution = 6.054

Defensive6.70
StatValueLeague rated(ratio)WeightContribution
Saves22.5135.1950.31.558
Blocks00.9742.9540.20.591
Takeaways94.3469.1590.252.29
Goals conceded26.2699.0460.252.262

Σ contribution = 6.701

League average is 6.0 on Performance, Offensive and Defensive, and 100 on Pucker+. Every formula.

SoccerboyEJ Provo Polar Bears

rated once over the whole game. Baseline: the player's own division.

Performance6.0
StatValueLeague avgStd devWeightzContribution
Goals32.051.810.230.5250.121
Assists31.771.610.190.7640.145
Shots34.633.240.09-0.503-0.045
Passes1520.458.530.08-0.639-0.051
Saves12.513.170.19-0.477-0.091
Blocks00.971.170.11-0.831-0.091
Takeaways54.353.540.110.1850.02

6.0 + clip(Σ 0.008 × 2, −3 to 3) = 6.015, then +0.25 hot shooting, −0.3 turnovers → 6.0

Pucker+93
StatValueLeague rateRatioWeightContribution
Goal contribution63.6731.6340.320.523
Shots34.6280.6480.080.052
Saves12.5130.3980.150.06
Blocks00.97400.070
Takeaways54.3461.150.120.138
Passes1520.4490.7340.080.059
Faceoff win rate0.7780.5051.5390.030.046

Σ 0.877 ÷ Σ weights 0.85 = 1.032 − 0.097 turnover penalty = 0.935 → ×100 = 93.45 → 93

Offensive8.86
RateValueLeagueWeightContribution
Points per possession-sec0.1280.0830.43.194
Shooting %10.4430.21.88
Assists per pass0.20.0870.43.784

Σ contribution = 8.857

Defensive5.66
StatValueLeague rated(ratio)WeightContribution
Saves12.5133.8460.31.154
Blocks00.9742.9540.20.591
Takeaways54.3466.5970.251.649
Goals conceded26.2699.0460.252.262

Σ contribution = 5.656

League average is 6.0 on Performance, Offensive and Defensive, and 100 on Pucker+. Every formula.

Chaser Provo Polar Bears

rated once over the whole game. Baseline: the player's own division.

Performance5.7
StatValueLeague avgStd devWeightzContribution
Goals32.051.810.230.5250.121
Assists11.771.610.19-0.477-0.091
Shots54.633.240.090.1150.01
Passes2120.458.530.080.0650.005
Saves02.513.170.19-0.793-0.151
Blocks00.971.170.11-0.831-0.091
Takeaways24.353.540.11-0.663-0.073

6.0 + clip(Σ −0.269 × 2, −3 to 3) = 5.461, then +0.25 hot shooting → 5.7

Pucker+71
StatValueLeague rateRatioWeightContribution
Goal contribution43.6731.0890.320.348
Shots54.6281.080.080.086
Saves02.51300.150
Blocks00.97400.070
Takeaways24.3460.460.120.055
Passes2120.4491.0270.080.082
Faceoff win rate0.50.5050.9890.030.03

Σ 0.602 ÷ Σ weights 0.85 = 0.708 → ×100 = 70.82 → 71

Offensive7.02
RateValueLeagueWeightContribution
Points per possession-sec0.20.0830.43.823
Shooting %0.60.4430.21.472
Assists per pass0.0480.0870.41.726

Σ contribution = 7.02

Defensive4.75
StatValueLeague rated(ratio)WeightContribution
Saves02.5132.9540.30.886
Blocks00.9742.9540.20.591
Takeaways24.3464.0290.251.007
Goals conceded26.2699.0460.252.262

Σ contribution = 4.746

League average is 6.0 on Performance, Offensive and Defensive, and 100 on Pucker+. Every formula.