PPHomePlymouth Plaggers
3–1Final
DDAwayDenver Ducks

Sep 3, 2023 · 6v6 Major League · East Bethel Garden

MVP [MIA] kyler · 7.1 performance rating

Writing the recap…

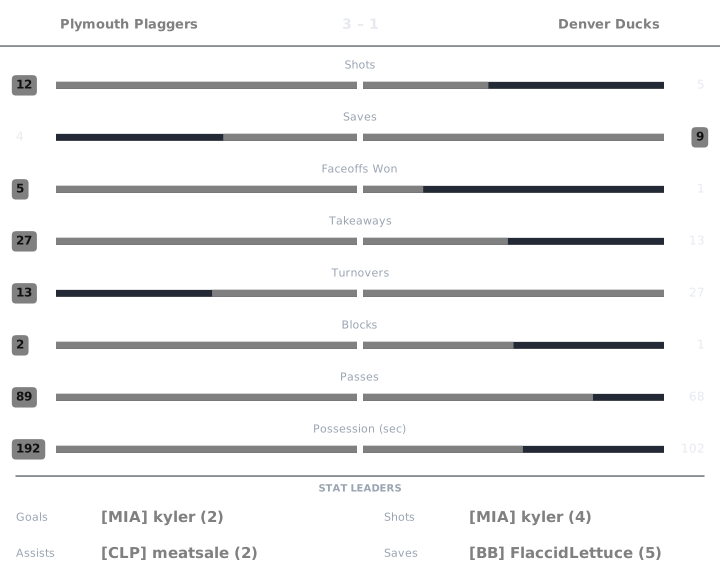
Match box score chart

APR is the Alto Performance Rating: 0 to 10, with 6.0 league average. Click any APR to see the working.

Plymouth Plaggers

PlayerGAPtsShotsSavesFOWFOLTKTOBlkPassesGWGPossAPRPucker+OffDef
[CLP] Panarin0000400300100:17902.957.62
[CLP] meatsale02230106201700:321426.656.16
[MIA] Kylar02200405422301:041505.517.46
[MIA] Rodeo00020003201500:09422.955.51
[MIA] kyler20240007302000:491454.536.20
[ORL] Mace10130013201300:21804.325.51

Denver Ducks

PlayerGAPtsShotsSavesFOWFOLTKTOBlkPassesGWGPossAPRPucker+OffDef
[BB] FlaccidLettuce0000513030200:27882.955.89
[BPH] hzr011000121001400:1805.674.39
[CTS] BAM01111005601600:24765.106.27
[FF] Kazxi00020003401100:12282.954.81
[PRO] Chaser00002012011500:11872.957.62
[TSM] ItsG10121001401000:10675.894.94

Panarin Plymouth Plaggers

rated once over the whole game. Baseline: the player's own division.

APR5.6
StatValueLeague avgStd devWeightzContribution
Goals00.540.850.23-0.635-0.146
Assists00.6710.19-0.674-0.128
Shots01.541.980.09-0.777-0.07
Passes112.56.340.08-1.814-0.145
Saves40.991.980.191.5230.289
Blocks00.290.660.11-0.45-0.049
Takeaways32.342.250.110.2930.032

6.0 + clip(Σ −0.217 × 2, −3 to 3) = 5.566, nothing hit the bonus or penalty thresholds → 5.6

Pucker+90
StatValueLeague rateRatioWeightContribution
Goal contribution01.10600.320
Shots01.5400.080
Saves40.9924.0310.150.605
Blocks00.29500.070
Takeaways32.3421.2810.120.154
Passes112.4960.080.080.006
Faceoff win rate00.50500.030

Σ 0.765 ÷ Σ weights 0.85 = 0.9 → ×100 = 89.96 → 90

Offensive2.95
RateValueLeagueWeightContribution
Points per possession-sec00.0650.41.181
Shooting %00.3490.20.591
Assists per pass00.0540.41.181

Σ contribution = 2.954

Defensive7.62
StatValueLeague rated(ratio)WeightContribution
Saves40.9929.9810.32.994
Blocks00.2952.9540.20.591
Takeaways32.3427.0950.251.774
Goals conceded13.1799.0460.252.262

Σ contribution = 7.621

League average is 6.0 on APR, Offensive and Defensive, and 100 on Pucker+. Every formula.

meatsale Plymouth Plaggers

rated once over the whole game. Baseline: the player's own division.

APR6.3
StatValueLeague avgStd devWeightzContribution
Goals00.540.850.23-0.635-0.146
Assists20.6710.191.3350.254
Shots31.541.980.090.7370.066
Passes1712.56.340.080.710.057
Saves00.991.980.19-0.502-0.095
Blocks00.290.660.11-0.45-0.049
Takeaways62.342.250.111.6280.179

6.0 + clip(Σ 0.265 × 2, −3 to 3) = 6.53, then −0.2 cold shooting → 6.3

Pucker+142
StatValueLeague rateRatioWeightContribution
Goal contribution21.1061.8090.320.579
Shots31.541.9480.080.156
Saves00.99200.150
Blocks00.29500.070
Takeaways62.3422.5620.120.307
Passes1712.4961.360.080.109
Faceoff win rate10.5051.980.030.059

Σ 1.21 ÷ Σ weights 0.85 = 1.424 → ×100 = 142.4 → 142

Offensive6.65
RateValueLeagueWeightContribution
Points per possession-sec0.0630.0650.42.334
Shooting %00.3490.20.591
Assists per pass0.1180.0540.43.729

Σ contribution = 6.654

Defensive6.16
StatValueLeague rated(ratio)WeightContribution
Saves00.9922.9540.30.886
Blocks00.2952.9540.20.591
Takeaways62.3429.6630.252.416
Goals conceded13.1799.0460.252.262

Σ contribution = 6.155

League average is 6.0 on APR, Offensive and Defensive, and 100 on Pucker+. Every formula.

Kylar Plymouth Plaggers

rated once over the whole game. Baseline: the player's own division.

APR7.0
StatValueLeague avgStd devWeightzContribution
Goals00.540.850.23-0.635-0.146
Assists20.6710.191.3350.254
Shots01.541.980.09-0.777-0.07
Passes2312.56.340.081.6570.133
Saves00.991.980.19-0.502-0.095
Blocks20.290.660.112.6030.286
Takeaways52.342.250.111.1830.13

6.0 + clip(Σ 0.491 × 2, −3 to 3) = 6.982, nothing hit the bonus or penalty thresholds → 7.0

Pucker+150
StatValueLeague rateRatioWeightContribution
Goal contribution1.51.1061.3570.320.434
Shots01.5400.080
Saves00.99200.150
Blocks20.2956.7870.070.475
Takeaways52.3422.1350.120.256
Passes2312.4961.8410.080.147
Faceoff win rate10.5051.980.030.059

Σ 1.372 ÷ Σ weights 0.85 = 1.614 − 0.11 turnover penalty = 1.504 → ×100 = 150.45 → 150

Offensive5.51
RateValueLeagueWeightContribution
Points per possession-sec0.0310.0650.41.635
Shooting %00.3490.20.591
Assists per pass0.0870.0540.43.281

Σ contribution = 5.506

Defensive7.46
StatValueLeague rated(ratio)WeightContribution
Saves00.9922.9540.30.886
Blocks20.295100.22
Takeaways52.3429.2510.252.313
Goals conceded13.1799.0460.252.262

Σ contribution = 7.461

League average is 6.0 on APR, Offensive and Defensive, and 100 on Pucker+. Every formula.

Rodeo Plymouth Plaggers

rated once over the whole game. Baseline: the player's own division.

APR5.1
StatValueLeague avgStd devWeightzContribution
Goals00.540.850.23-0.635-0.146
Assists00.6710.19-0.674-0.128
Shots21.541.980.090.2320.021
Passes1512.56.340.080.3950.032
Saves00.991.980.19-0.502-0.095
Blocks00.290.660.11-0.45-0.049
Takeaways32.342.250.110.2930.032

6.0 + clip(Σ −0.334 × 2, −3 to 3) = 5.331, then −0.2 cold shooting → 5.1

Pucker+42
StatValueLeague rateRatioWeightContribution
Goal contribution01.10600.320
Shots21.541.2990.080.104
Saves00.99200.150
Blocks00.29500.070
Takeaways32.3421.2810.120.154
Passes1512.4961.20.080.096
Faceoff win rate00.50500.030

Σ 0.354 ÷ Σ weights 0.85 = 0.416 → ×100 = 41.6 → 42

Offensive2.95
RateValueLeagueWeightContribution
Points per possession-sec00.0650.41.181
Shooting %00.3490.20.591
Assists per pass00.0540.41.181

Σ contribution = 2.954

Defensive5.51
StatValueLeague rated(ratio)WeightContribution
Saves00.9922.9540.30.886
Blocks00.2952.9540.20.591
Takeaways32.3427.0950.251.774
Goals conceded13.1799.0460.252.262

Σ contribution = 5.513

League average is 6.0 on APR, Offensive and Defensive, and 100 on Pucker+. Every formula.

kyler Plymouth Plaggers

rated once over the whole game. Baseline: the player's own division.

APR7.1
StatValueLeague avgStd devWeightzContribution
Goals20.540.850.231.7260.397
Assists00.6710.19-0.674-0.128
Shots41.541.980.091.2410.112
Passes2012.56.340.081.1840.095
Saves00.991.980.19-0.502-0.095
Blocks00.290.660.11-0.45-0.049
Takeaways72.342.250.112.0730.228

6.0 + clip(Σ 0.558 × 2, −3 to 3) = 7.117, nothing hit the bonus or penalty thresholds → 7.1

Pucker+145
StatValueLeague rateRatioWeightContribution
Goal contribution21.1061.8090.320.579
Shots41.542.5980.080.208
Saves00.99200.150
Blocks00.29500.070
Takeaways72.3422.9890.120.359
Passes2012.4961.60.080.128
Faceoff win rate00.50500.030

Σ 1.273 ÷ Σ weights 0.85 = 1.498 − 0.045 turnover penalty = 1.453 → ×100 = 145.33 → 145

Offensive4.53
RateValueLeagueWeightContribution
Points per possession-sec0.0410.0650.41.828
Shooting %0.50.3490.21.525
Assists per pass00.0540.41.181

Σ contribution = 4.535

Defensive6.20
StatValueLeague rated(ratio)WeightContribution
Saves00.9922.9540.30.886
Blocks00.2952.9540.20.591
Takeaways72.3429.8530.252.463
Goals conceded13.1799.0460.252.262

Σ contribution = 6.202

League average is 6.0 on APR, Offensive and Defensive, and 100 on Pucker+. Every formula.

Mace Plymouth Plaggers

rated once over the whole game. Baseline: the player's own division.

APR5.7
StatValueLeague avgStd devWeightzContribution
Goals10.540.850.230.5450.125
Assists00.6710.19-0.674-0.128
Shots31.541.980.090.7370.066
Passes1312.56.340.080.0790.006
Saves00.991.980.19-0.502-0.095
Blocks00.290.660.11-0.45-0.049
Takeaways32.342.250.110.2930.032

6.0 + clip(Σ −0.043 × 2, −3 to 3) = 5.914, then −0.2 cold shooting → 5.7

Pucker+80
StatValueLeague rateRatioWeightContribution
Goal contribution11.1060.9050.320.289
Shots31.541.9480.080.156
Saves00.99200.150
Blocks00.29500.070
Takeaways32.3421.2810.120.154
Passes1312.4961.040.080.083
Faceoff win rate00.50500.030

Σ 0.682 ÷ Σ weights 0.85 = 0.803 → ×100 = 80.26 → 80

Offensive4.32
RateValueLeagueWeightContribution
Points per possession-sec0.0480.0650.41.979
Shooting %0.3330.3490.21.163
Assists per pass00.0540.41.181

Σ contribution = 4.324

Defensive5.51
StatValueLeague rated(ratio)WeightContribution
Saves00.9922.9540.30.886
Blocks00.2952.9540.20.591
Takeaways32.3427.0950.251.774
Goals conceded13.1799.0460.252.262

Σ contribution = 5.513

League average is 6.0 on APR, Offensive and Defensive, and 100 on Pucker+. Every formula.

FlaccidLettuce Denver Ducks

rated once over the whole game. Baseline: the player's own division.

APR5.5
StatValueLeague avgStd devWeightzContribution
Goals00.540.850.23-0.635-0.146
Assists00.6710.19-0.674-0.128
Shots01.541.980.09-0.777-0.07
Passes212.56.340.08-1.656-0.132
Saves50.991.980.192.0290.386
Blocks00.290.660.11-0.45-0.049
Takeaways02.342.250.11-1.042-0.115

6.0 + clip(Σ −0.255 × 2, −3 to 3) = 5.49, nothing hit the bonus or penalty thresholds → 5.5

Pucker+88
StatValueLeague rateRatioWeightContribution
Goal contribution01.10600.320
Shots01.5400.080
Saves50.9925.0380.150.756
Blocks00.29500.070
Takeaways02.34200.120
Passes212.4960.160.080.013
Faceoff win rate0.250.5050.4950.030.015

Σ 0.783 ÷ Σ weights 0.85 = 0.922 − 0.045 turnover penalty = 0.877 → ×100 = 87.68 → 88

Offensive2.95
RateValueLeagueWeightContribution
Points per possession-sec00.0650.41.181
Shooting %00.3490.20.591
Assists per pass00.0540.41.181

Σ contribution = 2.954

Defensive5.89
StatValueLeague rated(ratio)WeightContribution
Saves50.9929.9980.32.999
Blocks00.2952.9540.20.591
Takeaways02.3422.9540.250.738
Goals conceded33.1796.2380.251.559

Σ contribution = 5.887

League average is 6.0 on APR, Offensive and Defensive, and 100 on Pucker+. Every formula.

hzr Denver Ducks

rated once over the whole game. Baseline: the player's own division.

APR5.1
StatValueLeague avgStd devWeightzContribution
Goals00.540.850.23-0.635-0.146
Assists10.6710.190.330.063
Shots01.541.980.09-0.777-0.07
Passes1412.56.340.080.2370.019
Saves00.991.980.19-0.502-0.095
Blocks00.290.660.11-0.45-0.049
Takeaways22.342.250.11-0.152-0.017

6.0 + clip(Σ −0.296 × 2, −3 to 3) = 5.408, then −0.3 turnovers → 5.1

Pucker+0
StatValueLeague rateRatioWeightContribution
Goal contribution0.51.1060.4520.320.145
Shots01.5400.080
Saves00.99200.150
Blocks00.29500.070
Takeaways22.3420.8540.120.102
Passes1412.4961.120.080.09
Faceoff win rate00.50500.030

Σ 0.337 ÷ Σ weights 0.85 = 0.396 − 0.499 turnover penalty = −0.103 → ×100 = 0 → 0

Offensive5.67
RateValueLeagueWeightContribution
Points per possession-sec0.0560.0650.42.165
Shooting %00.3490.20.591
Assists per pass0.0710.0540.42.91

Σ contribution = 5.665

Defensive4.39
StatValueLeague rated(ratio)WeightContribution
Saves00.9922.9540.30.886
Blocks00.2952.9540.20.591
Takeaways22.3425.420.251.355
Goals conceded33.1796.2380.251.559

Σ contribution = 4.391

League average is 6.0 on APR, Offensive and Defensive, and 100 on Pucker+. Every formula.

BAM Denver Ducks

rated once over the whole game. Baseline: the player's own division.

APR5.5
StatValueLeague avgStd devWeightzContribution
Goals00.540.850.23-0.635-0.146
Assists10.6710.190.330.063
Shots11.541.980.09-0.272-0.025
Passes1612.56.340.080.5530.044
Saves10.991.980.190.0040.001
Blocks00.290.660.11-0.45-0.049
Takeaways52.342.250.111.1830.13

6.0 + clip(Σ 0.018 × 2, −3 to 3) = 6.036, then −0.3 turnovers, −0.2 cold shooting → 5.5

Pucker+76
StatValueLeague rateRatioWeightContribution
Goal contribution11.1060.9050.320.289
Shots11.540.6490.080.052
Saves10.9921.0080.150.151
Blocks00.29500.070
Takeaways52.3422.1350.120.256
Passes1612.4961.280.080.102
Faceoff win rate00.50500.030

Σ 0.851 ÷ Σ weights 0.85 = 1.001 − 0.24 turnover penalty = 0.761 → ×100 = 76.17 → 76

Offensive5.10
RateValueLeagueWeightContribution
Points per possession-sec0.0420.0650.41.846
Shooting %00.3490.20.591
Assists per pass0.0620.0540.42.66

Σ contribution = 5.097

Defensive6.27
StatValueLeague rated(ratio)WeightContribution
Saves10.9926.0310.31.809
Blocks00.2952.9540.20.591
Takeaways52.3429.2510.252.313
Goals conceded33.1796.2380.251.559

Σ contribution = 6.272

League average is 6.0 on APR, Offensive and Defensive, and 100 on Pucker+. Every formula.

Kazxi Denver Ducks

rated once over the whole game. Baseline: the player's own division.

APR5.0
StatValueLeague avgStd devWeightzContribution
Goals00.540.850.23-0.635-0.146
Assists00.6710.19-0.674-0.128
Shots21.541.980.090.2320.021
Passes1112.56.340.08-0.236-0.019
Saves00.991.980.19-0.502-0.095
Blocks00.290.660.11-0.45-0.049
Takeaways32.342.250.110.2930.032

6.0 + clip(Σ −0.385 × 2, −3 to 3) = 5.23, then −0.2 cold shooting → 5.0

Pucker+28
StatValueLeague rateRatioWeightContribution
Goal contribution01.10600.320
Shots21.541.2990.080.104
Saves00.99200.150
Blocks00.29500.070
Takeaways32.3421.2810.120.154
Passes1112.4960.880.080.07
Faceoff win rate00.50500.030

Σ 0.328 ÷ Σ weights 0.85 = 0.386 − 0.11 turnover penalty = 0.276 → ×100 = 27.62 → 28

Offensive2.95
RateValueLeagueWeightContribution
Points per possession-sec00.0650.41.181
Shooting %00.3490.20.591
Assists per pass00.0540.41.181

Σ contribution = 2.954

Defensive4.81
StatValueLeague rated(ratio)WeightContribution
Saves00.9922.9540.30.886
Blocks00.2952.9540.20.591
Takeaways32.3427.0950.251.774
Goals conceded33.1796.2380.251.559

Σ contribution = 4.81

League average is 6.0 on APR, Offensive and Defensive, and 100 on Pucker+. Every formula.

Chaser Denver Ducks

rated once over the whole game. Baseline: the player's own division.

APR5.8
StatValueLeague avgStd devWeightzContribution
Goals00.540.850.23-0.635-0.146
Assists00.6710.19-0.674-0.128
Shots01.541.980.09-0.777-0.07
Passes1512.56.340.080.3950.032
Saves20.991.980.190.510.097
Blocks10.290.660.111.0770.118
Takeaways22.342.250.11-0.152-0.017

6.0 + clip(Σ −0.114 × 2, −3 to 3) = 5.772, nothing hit the bonus or penalty thresholds → 5.8

Pucker+87
StatValueLeague rateRatioWeightContribution
Goal contribution01.10600.320
Shots01.5400.080
Saves20.9922.0150.150.302
Blocks10.2953.3940.070.238
Takeaways22.3420.8540.120.102
Passes1512.4961.20.080.096
Faceoff win rate00.50500.030

Σ 0.738 ÷ Σ weights 0.85 = 0.869 → ×100 = 86.86 → 87

Offensive2.95
RateValueLeagueWeightContribution
Points per possession-sec00.0650.41.181
Shooting %00.3490.20.591
Assists per pass00.0540.41.181

Σ contribution = 2.954

Defensive7.62
StatValueLeague rated(ratio)WeightContribution
Saves20.9929.0720.32.722
Blocks10.2959.9340.21.987
Takeaways22.3425.420.251.355
Goals conceded33.1796.2380.251.559

Σ contribution = 7.623

League average is 6.0 on APR, Offensive and Defensive, and 100 on Pucker+. Every formula.

ItsG Denver Ducks

rated once over the whole game. Baseline: the player's own division.

APR5.7
StatValueLeague avgStd devWeightzContribution
Goals10.540.850.230.5450.125
Assists00.6710.19-0.674-0.128
Shots21.541.980.090.2320.021
Passes1012.56.340.08-0.394-0.032
Saves10.991.980.190.0040.001
Blocks00.290.660.11-0.45-0.049
Takeaways12.342.250.11-0.597-0.066

6.0 + clip(Σ −0.128 × 2, −3 to 3) = 5.745, nothing hit the bonus or penalty thresholds → 5.7

Pucker+67
StatValueLeague rateRatioWeightContribution
Goal contribution11.1060.9050.320.289
Shots21.541.2990.080.104
Saves10.9921.0080.150.151
Blocks00.29500.070
Takeaways12.3420.4270.120.051
Passes1012.4960.80.080.064
Faceoff win rate00.50500.030

Σ 0.66 ÷ Σ weights 0.85 = 0.776 − 0.11 turnover penalty = 0.666 → ×100 = 66.64 → 67

Offensive5.89
RateValueLeagueWeightContribution
Points per possession-sec0.10.0650.43.181
Shooting %0.50.3490.21.525
Assists per pass00.0540.41.181

Σ contribution = 5.888

Defensive4.94
StatValueLeague rated(ratio)WeightContribution
Saves10.9926.0310.31.809
Blocks00.2952.9540.20.591
Takeaways12.3423.930.250.982
Goals conceded33.1796.2380.251.559

Σ contribution = 4.941

League average is 6.0 on APR, Offensive and Defensive, and 100 on Pucker+. Every formula.