CCHomeColorado Cobras
8–5Final
MIAwayMaryland Ice Orcas

Aug 11, 2021 · Pro Division · The Hog Hole

MVP [CLP] Panarin · 6.4 performance rating

Writing the recap…

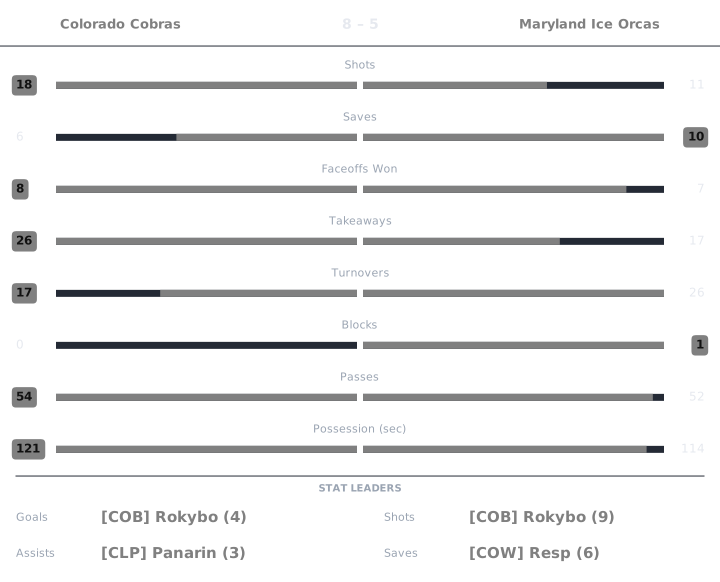
Match box score chart

Perf is a 0 to 10 Alto rating, 6.0 being league average. Click any Perf number to see the working behind it.

Colorado Cobras

PlayerGAPtsShotsSavesFOWFOLTKTOBlkPassesGWGPossPerfPucker+OffDef
[CLP] Panarin235642213701501:251266.387.04
[COB] Rokybo41591219502400:271086.215.30
[COW] Crusade22431444501500:09668.454.66

Maryland Ice Orcas

PlayerGAPtsShotsSavesFOWFOLTKTOBlkPassesGWGPossPerfPucker+OffDef
[COW] Resp01116322911400:50783.906.58
[COW] Timmy404812441001900:17776.224.17
[DCU] Skiztastic01111003301000:14254.964.07
[MIO] Cameron1011222840900:33504.465.10

Panarin Colorado Cobras

rated once over the whole game. Baseline: the player's own division.

Performance6.4
StatValueLeague avgStd devWeightzContribution
Goals22.21.630.23-0.125-0.029
Assists31.791.540.190.790.15
Shots64.652.590.090.5210.047
Passes1518.127.880.08-0.396-0.032
Saves42.452.550.190.6090.116
Blocks00.730.940.11-0.778-0.086
Takeaways137.394.70.111.1960.132

6.0 + clip(Σ 0.298 × 2, −3 to 3) = 6.597, then +0.3 takeaways, −0.3 turnovers, −0.2 cold shooting → 6.4

Pucker+126
StatValueLeague rateRatioWeightContribution
Goal contribution53.8841.2870.320.412
Shots64.6511.290.080.103
Saves42.4481.6340.150.245
Blocks00.72900.070
Takeaways137.3861.760.120.211
Passes1518.1210.8280.080.066
Faceoff win rate0.50.510.030.03

Σ 1.068 ÷ Σ weights 0.85 = 1.256 → ×100 = 125.61 → 126

Offensive6.38
RateValueLeagueWeightContribution
Points per possession-sec0.0590.1010.41.769
Shooting %0.3330.4740.20.97
Assists per pass0.20.0990.43.638

Σ contribution = 6.376

Defensive7.04
StatValueLeague rated(ratio)WeightContribution
Saves42.4488.2430.32.473
Blocks00.7292.9540.20.591
Takeaways137.3868.5650.252.141
Goals conceded56.7397.3370.251.834

Σ contribution = 7.039

League average is 6.0 on Performance, Offensive and Defensive, and 100 on Pucker+. Every formula.

Rokybo Colorado Cobras

rated once over the whole game. Baseline: the player's own division.

Performance6.4
StatValueLeague avgStd devWeightzContribution
Goals42.21.630.231.1040.254
Assists11.791.540.19-0.511-0.097
Shots94.652.590.091.6790.151
Passes2418.127.880.080.7460.06
Saves12.452.550.19-0.569-0.108
Blocks00.730.940.11-0.778-0.086
Takeaways97.394.70.110.3440.038

6.0 + clip(Σ 0.212 × 2, −3 to 3) = 6.424, nothing hit the bonus or penalty thresholds → 6.4

Pucker+108
StatValueLeague rateRatioWeightContribution
Goal contribution53.8841.2870.320.412
Shots94.6511.9350.080.155
Saves12.4480.4090.150.061
Blocks00.72900.070
Takeaways97.3861.2190.120.146
Passes2418.1211.3240.080.106
Faceoff win rate0.6670.51.3330.030.04

Σ 0.92 ÷ Σ weights 0.85 = 1.083 → ×100 = 108.26 → 108

Offensive6.21
RateValueLeagueWeightContribution
Points per possession-sec0.1850.1010.43.493
Shooting %0.4440.4740.21.151
Assists per pass0.0420.0990.41.567

Σ contribution = 6.211

Defensive5.30
StatValueLeague rated(ratio)WeightContribution
Saves12.4483.8760.31.163
Blocks00.7292.9540.20.591
Takeaways97.3866.8610.251.715
Goals conceded56.7397.3370.251.834

Σ contribution = 5.303

League average is 6.0 on Performance, Offensive and Defensive, and 100 on Pucker+. Every formula.

Crusade Colorado Cobras

rated once over the whole game. Baseline: the player's own division.

Performance5.5
StatValueLeague avgStd devWeightzContribution
Goals22.21.630.23-0.125-0.029
Assists21.791.540.190.1390.026
Shots34.652.590.09-0.637-0.057
Passes1518.127.880.08-0.396-0.032
Saves12.452.550.19-0.569-0.108
Blocks00.730.940.11-0.778-0.086
Takeaways47.394.70.11-0.721-0.079

6.0 + clip(Σ −0.364 × 2, −3 to 3) = 5.272, then +0.25 hot shooting → 5.5

Pucker+66
StatValueLeague rateRatioWeightContribution
Goal contribution3.53.8840.9010.320.288
Shots34.6510.6450.080.052
Saves12.4480.4090.150.061
Blocks00.72900.070
Takeaways47.3860.5420.120.065
Passes1518.1210.8280.080.066
Faceoff win rate0.50.510.030.03

Σ 0.562 ÷ Σ weights 0.85 = 0.662 → ×100 = 66.17 → 66

Offensive8.45
RateValueLeagueWeightContribution
Points per possession-sec0.4440.1010.43.997
Shooting %0.6670.4740.21.509
Assists per pass0.1330.0990.42.942

Σ contribution = 8.448

Defensive4.66
StatValueLeague rated(ratio)WeightContribution
Saves12.4483.8760.31.163
Blocks00.7292.9540.20.591
Takeaways47.3864.2850.251.071
Goals conceded56.7397.3370.251.834

Σ contribution = 4.659

League average is 6.0 on Performance, Offensive and Defensive, and 100 on Pucker+. Every formula.

Resp Maryland Ice Orcas

rated once over the whole game. Baseline: the player's own division.

Performance4.5
StatValueLeague avgStd devWeightzContribution
Goals02.21.630.23-1.353-0.311
Assists11.791.540.19-0.511-0.097
Shots14.652.590.09-1.41-0.127
Passes1418.127.880.08-0.523-0.042
Saves62.452.550.191.3950.265
Blocks10.730.940.110.2890.032
Takeaways27.394.70.11-1.147-0.126

6.0 + clip(Σ −0.407 × 2, −3 to 3) = 5.187, then −0.3 turnovers, −0.2 cold shooting, −0.2 goals against → 4.5

Pucker+78
StatValueLeague rateRatioWeightContribution
Goal contribution13.8840.2570.320.082
Shots14.6510.2150.080.017
Saves62.4482.4510.150.368
Blocks10.7291.3710.070.096
Takeaways27.3860.2710.120.032
Passes1418.1210.7730.080.062
Faceoff win rate0.60.51.20.030.036

Σ 0.694 ÷ Σ weights 0.85 = 0.816 − 0.034 turnover penalty = 0.782 → ×100 = 78.21 → 78

Offensive3.90
RateValueLeagueWeightContribution
Points per possession-sec0.020.1010.41.336
Shooting %00.4740.20.591
Assists per pass0.0710.0990.41.97

Σ contribution = 3.897

Defensive6.58
StatValueLeague rated(ratio)WeightContribution
Saves62.4489.5840.32.875
Blocks10.7297.4190.21.484
Takeaways27.3863.510.250.877
Goals conceded86.7395.3740.251.344

Σ contribution = 6.58

League average is 6.0 on Performance, Offensive and Defensive, and 100 on Pucker+. Every formula.

Timmy Maryland Ice Orcas

rated once over the whole game. Baseline: the player's own division.

Performance5.3
StatValueLeague avgStd devWeightzContribution
Goals42.21.630.231.1040.254
Assists01.791.540.19-1.162-0.221
Shots84.652.590.091.2930.116
Passes1918.127.880.080.1120.009
Saves12.452.550.19-0.569-0.108
Blocks00.730.940.11-0.778-0.086
Takeaways47.394.70.11-0.721-0.079

6.0 + clip(Σ −0.114 × 2, −3 to 3) = 5.771, then −0.3 turnovers, −0.2 goals against → 5.3

Pucker+77
StatValueLeague rateRatioWeightContribution
Goal contribution43.8841.030.320.33
Shots84.6511.720.080.138
Saves12.4480.4090.150.061
Blocks00.72900.070
Takeaways47.3860.5420.120.065
Passes1918.1211.0490.080.084
Faceoff win rate0.3330.50.6660.030.02

Σ 0.697 ÷ Σ weights 0.85 = 0.82 − 0.054 turnover penalty = 0.766 → ×100 = 76.61 → 77

Offensive6.22
RateValueLeagueWeightContribution
Points per possession-sec0.2350.1010.43.791
Shooting %0.50.4740.21.244
Assists per pass00.0990.41.181

Σ contribution = 6.217

Defensive4.17
StatValueLeague rated(ratio)WeightContribution
Saves12.4483.8760.31.163
Blocks00.7292.9540.20.591
Takeaways47.3864.2850.251.071
Goals conceded86.7395.3740.251.344

Σ contribution = 4.169

League average is 6.0 on Performance, Offensive and Defensive, and 100 on Pucker+. Every formula.

Skiztastic Maryland Ice Orcas

rated once over the whole game. Baseline: the player's own division.

Performance3.8
StatValueLeague avgStd devWeightzContribution
Goals02.21.630.23-1.353-0.311
Assists11.791.540.19-0.511-0.097
Shots14.652.590.09-1.41-0.127
Passes1018.127.880.08-1.031-0.082
Saves12.452.550.19-0.569-0.108
Blocks00.730.940.11-0.778-0.086
Takeaways37.394.70.11-0.934-0.103

6.0 + clip(Σ −0.914 × 2, −3 to 3) = 4.172, then −0.2 cold shooting, −0.2 goals against → 3.8

Pucker+25
StatValueLeague rateRatioWeightContribution
Goal contribution0.53.8840.1290.320.041
Shots14.6510.2150.080.017
Saves12.4480.4090.150.061
Blocks00.72900.070
Takeaways37.3860.4060.120.049
Passes1018.1210.5520.080.044
Faceoff win rate00.500.030

Σ 0.213 ÷ Σ weights 0.85 = 0.25 → ×100 = 25.01 → 25

Offensive4.96
RateValueLeagueWeightContribution
Points per possession-sec0.0710.1010.41.945
Shooting %00.4740.20.591
Assists per pass0.10.0990.42.423

Σ contribution = 4.959

Defensive4.07
StatValueLeague rated(ratio)WeightContribution
Saves12.4483.8760.31.163
Blocks00.7292.9540.20.591
Takeaways37.3863.8690.250.967
Goals conceded86.7395.3740.251.344

Σ contribution = 4.065

League average is 6.0 on Performance, Offensive and Defensive, and 100 on Pucker+. Every formula.

Cameron Maryland Ice Orcas

rated once over the whole game. Baseline: the player's own division.

Performance4.6
StatValueLeague avgStd devWeightzContribution
Goals12.21.630.23-0.739-0.17
Assists01.791.540.19-1.162-0.221
Shots14.652.590.09-1.41-0.127
Passes918.127.880.08-1.158-0.093
Saves22.452.550.19-0.176-0.033
Blocks00.730.940.11-0.778-0.086
Takeaways87.394.70.110.1310.014

6.0 + clip(Σ −0.715 × 2, −3 to 3) = 4.57, then +0.25 hot shooting, −0.2 goals against → 4.6

Pucker+50
StatValueLeague rateRatioWeightContribution
Goal contribution13.8840.2570.320.082
Shots14.6510.2150.080.017
Saves22.4480.8170.150.123
Blocks00.72900.070
Takeaways87.3861.0830.120.13
Passes918.1210.4970.080.04
Faceoff win rate0.50.510.030.03

Σ 0.422 ÷ Σ weights 0.85 = 0.496 → ×100 = 49.63 → 50

Offensive4.46
RateValueLeagueWeightContribution
Points per possession-sec0.030.1010.41.433
Shooting %10.4740.21.844
Assists per pass00.0990.41.181

Σ contribution = 4.458

Defensive5.10
StatValueLeague rated(ratio)WeightContribution
Saves22.4485.2760.31.583
Blocks00.7292.9540.20.591
Takeaways87.3866.3320.251.583
Goals conceded86.7395.3740.251.344

Σ contribution = 5.101

League average is 6.0 on Performance, Offensive and Defensive, and 100 on Pucker+. Every formula.