GBHomeGood Better Best
1–11Final
BCAwayBrampton Cows

Jan 21, 2026 · Central B - East vs South · Ben Johnson related theme

MVP [CLUD/HHRS] Tactical Miss · 8.3 performance rating

Writing the recap…

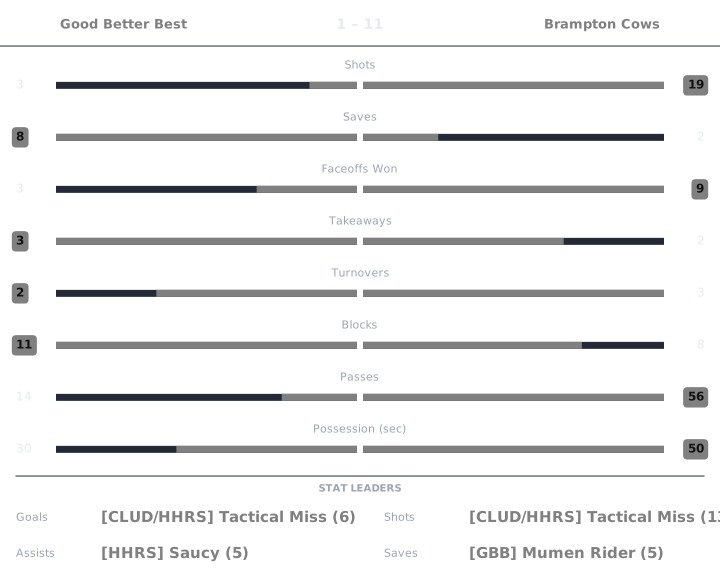
Match box score chart

Perf is a 0 to 10 Alto rating, 6.0 being league average. Click any Perf number to see the working behind it.

Good Better Best

PlayerGAPtsShotsSavesFOWFOLTKTOBlkPassesGWGPossPerfPucker+OffDef
[GBB] Mumen Rider0000524002000:00472.955.37
[GBB] mattyb301012310314600:26734.115.74
[GBB] mattyb690001005015800:04142.953.72

Brampton Cows

PlayerGAPtsShotsSavesFOWFOLTKTOBlkPassesGWGPossPerfPucker+OffDef
[CLUD/HHRS] Tactical Miss639130110132100:141648.624.71
[HHRS] Saucy35841301242000:201529.635.33
[OCP/BRC] lacaaas23521521011500:16929.695.05

Mumen Rider Good Better Best

rated once over the whole game. Baseline: the player's own division.

Performance4.3
StatValueLeague avgStd devWeightzContribution
Goals01.641.520.23-1.076-0.247
Assists01.341.190.19-1.129-0.214
Shots03.732.780.09-1.345-0.121
Passes016.097.240.08-2.222-0.178
Saves52.12.320.191.2520.238
Blocks26.144.080.11-1.015-0.112
Takeaways03.072.820.11-1.091-0.12

6.0 + clip(Σ −0.755 × 2, −3 to 3) = 4.491, then −0.2 goals against → 4.3

Pucker+47
StatValueLeague rateRatioWeightContribution
Goal contribution02.86700.320
Shots03.73400.080
Saves52.0962.3860.150.358
Blocks26.1380.3260.070.023
Takeaways03.07400.120
Passes016.08500.080
Faceoff win rate0.3330.50.6670.030.02

Σ 0.401 ÷ Σ weights 0.85 = 0.471 → ×100 = 47.14 → 47

Offensive2.95
RateValueLeagueWeightContribution
Points per possession-sec00.0820.41.181
Shooting %00.4390.20.591
Assists per pass00.0830.41.181

Σ contribution = 2.954

Defensive5.37
StatValueLeague rated(ratio)WeightContribution
Saves52.0969.5290.32.859
Blocks26.1383.6490.20.73
Takeaways03.0742.9540.250.738
Goals conceded115.5324.1610.251.04

Σ contribution = 5.367

League average is 6.0 on Performance, Offensive and Defensive, and 100 on Pucker+. Every formula.

mattyb30 Good Better Best

rated once over the whole game. Baseline: the player's own division.

Performance4.9
StatValueLeague avgStd devWeightzContribution
Goals11.641.520.23-0.419-0.096
Assists01.341.190.19-1.129-0.214
Shots23.732.780.09-0.625-0.056
Passes616.097.240.08-1.393-0.111
Saves32.12.320.190.390.074
Blocks46.144.080.11-0.525-0.058
Takeaways33.072.820.11-0.026-0.003

6.0 + clip(Σ −0.465 × 2, −3 to 3) = 5.07, then −0.2 goals against → 4.9

Pucker+73
StatValueLeague rateRatioWeightContribution
Goal contribution12.8670.3490.320.112
Shots23.7340.5360.080.043
Saves32.0961.4310.150.215
Blocks46.1380.6520.070.046
Takeaways33.0740.9760.120.117
Passes616.0850.3730.080.03
Faceoff win rate10.520.030.06

Σ 0.622 ÷ Σ weights 0.85 = 0.731 → ×100 = 73.15 → 73

Offensive4.11
RateValueLeagueWeightContribution
Points per possession-sec0.0380.0820.41.619
Shooting %0.50.4390.21.311
Assists per pass00.0830.41.181

Σ contribution = 4.112

Defensive5.74
StatValueLeague rated(ratio)WeightContribution
Saves32.0967.6260.32.288
Blocks46.1384.660.20.932
Takeaways33.0745.9030.251.476
Goals conceded115.5324.1610.251.04

Σ contribution = 5.736

League average is 6.0 on Performance, Offensive and Defensive, and 100 on Pucker+. Every formula.

mattyb69 Good Better Best

rated once over the whole game. Baseline: the player's own division.

Performance3.7
StatValueLeague avgStd devWeightzContribution
Goals01.641.520.23-1.076-0.247
Assists01.341.190.19-1.129-0.214
Shots13.732.780.09-0.985-0.089
Passes816.097.240.08-1.117-0.089
Saves02.12.320.19-0.904-0.172
Blocks56.144.080.11-0.279-0.031
Takeaways03.072.820.11-1.091-0.12

6.0 + clip(Σ −0.962 × 2, −3 to 3) = 4.075, then −0.2 cold shooting, −0.2 goals against → 3.7

Pucker+14
StatValueLeague rateRatioWeightContribution
Goal contribution02.86700.320
Shots13.7340.2680.080.021
Saves02.09600.150
Blocks56.1380.8150.070.057
Takeaways03.07400.120
Passes816.0850.4970.080.04
Faceoff win rate00.500.030

Σ 0.118 ÷ Σ weights 0.85 = 0.139 → ×100 = 13.91 → 14

Offensive2.95
RateValueLeagueWeightContribution
Points per possession-sec00.0820.41.181
Shooting %00.4390.20.591
Assists per pass00.0830.41.181

Σ contribution = 2.954

Defensive3.72
StatValueLeague rated(ratio)WeightContribution
Saves02.0962.9540.30.886
Blocks56.1385.2670.21.053
Takeaways03.0742.9540.250.738
Goals conceded115.5324.1610.251.04

Σ contribution = 3.717

League average is 6.0 on Performance, Offensive and Defensive, and 100 on Pucker+. Every formula.

Tactical Miss Brampton Cows

rated once over the whole game. Baseline: the player's own division.

Performance8.3
StatValueLeague avgStd devWeightzContribution
Goals61.641.520.232.8640.659
Assists31.341.190.191.3980.266
Shots133.732.780.093.3390.3
Passes2116.097.240.080.6790.054
Saves02.12.320.19-0.904-0.172
Blocks36.144.080.11-0.77-0.085
Takeaways03.072.820.11-1.091-0.12

6.0 + clip(Σ 0.903 × 2, −3 to 3) = 7.805, then +0.5 hat trick → 8.3

Pucker+164
StatValueLeague rateRatioWeightContribution
Goal contribution8.52.8672.9650.320.949
Shots133.7343.4810.080.279
Saves02.09600.150
Blocks36.1380.4890.070.034
Takeaways03.07400.120
Passes2116.0851.3060.080.104
Faceoff win rate0.50.510.030.03

Σ 1.396 ÷ Σ weights 0.85 = 1.642 → ×100 = 164.22 → 164

Offensive8.62
RateValueLeagueWeightContribution
Points per possession-sec0.6430.0820.44
Shooting %0.4620.4390.21.242
Assists per pass0.1430.0830.43.381

Σ contribution = 8.623

Defensive4.71
StatValueLeague rated(ratio)WeightContribution
Saves02.0962.9540.30.886
Blocks36.1384.1160.20.823
Takeaways03.0742.9540.250.738
Goals conceded15.5329.0460.252.262

Σ contribution = 4.709

League average is 6.0 on Performance, Offensive and Defensive, and 100 on Pucker+. Every formula.

Saucy Brampton Cows

rated once over the whole game. Baseline: the player's own division.

Performance7.9
StatValueLeague avgStd devWeightzContribution
Goals31.641.520.230.8940.206
Assists51.341.190.193.0820.586
Shots43.732.780.090.0960.009
Passes2016.097.240.080.5410.043
Saves12.12.320.19-0.473-0.09
Blocks46.144.080.11-0.525-0.058
Takeaways13.072.820.11-0.736-0.081

6.0 + clip(Σ 0.615 × 2, −3 to 3) = 7.229, then +0.4 playmaker, +0.25 hot shooting → 7.9

Pucker+152
StatValueLeague rateRatioWeightContribution
Goal contribution82.8672.790.320.893
Shots43.7341.0710.080.086
Saves12.0960.4770.150.072
Blocks46.1380.6520.070.046
Takeaways13.0740.3250.120.039
Passes2016.0851.2430.080.099
Faceoff win rate10.520.030.06

Σ 1.294 ÷ Σ weights 0.85 = 1.523 → ×100 = 152.27 → 152

Offensive9.63
RateValueLeagueWeightContribution
Points per possession-sec0.40.0820.43.999
Shooting %0.750.4390.21.688
Assists per pass0.250.0830.43.942

Σ contribution = 9.629

Defensive5.33
StatValueLeague rated(ratio)WeightContribution
Saves12.0964.080.31.224
Blocks46.1384.660.20.932
Takeaways13.0743.6480.250.912
Goals conceded15.5329.0460.252.262

Σ contribution = 5.33

League average is 6.0 on Performance, Offensive and Defensive, and 100 on Pucker+. Every formula.

lacaaas Brampton Cows

rated once over the whole game. Baseline: the player's own division.

Performance6.1
StatValueLeague avgStd devWeightzContribution
Goals21.641.520.230.2380.055
Assists31.341.190.191.3980.266
Shots23.732.780.09-0.625-0.056
Passes1516.097.240.08-0.15-0.012
Saves12.12.320.19-0.473-0.09
Blocks16.144.080.11-1.261-0.139
Takeaways13.072.820.11-0.736-0.081

6.0 + clip(Σ −0.057 × 2, −3 to 3) = 5.885, then +0.25 hot shooting → 6.1

Pucker+92
StatValueLeague rateRatioWeightContribution
Goal contribution4.52.8671.570.320.502
Shots23.7340.5360.080.043
Saves12.0960.4770.150.072
Blocks16.1380.1630.070.011
Takeaways13.0740.3250.120.039
Passes1516.0850.9330.080.075
Faceoff win rate0.7140.51.4290.030.043

Σ 0.785 ÷ Σ weights 0.85 = 0.923 → ×100 = 92.3 → 92

Offensive9.69
RateValueLeagueWeightContribution
Points per possession-sec0.3130.0820.43.988
Shooting %10.4390.21.885
Assists per pass0.20.0830.43.817

Σ contribution = 9.69

Defensive5.05
StatValueLeague rated(ratio)WeightContribution
Saves12.0964.080.31.224
Blocks16.1383.2630.20.653
Takeaways13.0743.6480.250.912
Goals conceded15.5329.0460.252.262

Σ contribution = 5.051

League average is 6.0 on Performance, Offensive and Defensive, and 100 on Pucker+. Every formula.