Home · LILLong Island Lightning
8–6Final
Away · SSSchenectady Superstars

Mar 16, 2025 · Erveon Cup - Playoffs · The Thunderdome

MVP [LIL] milk · 7.3 performance rating

Writing the recap…

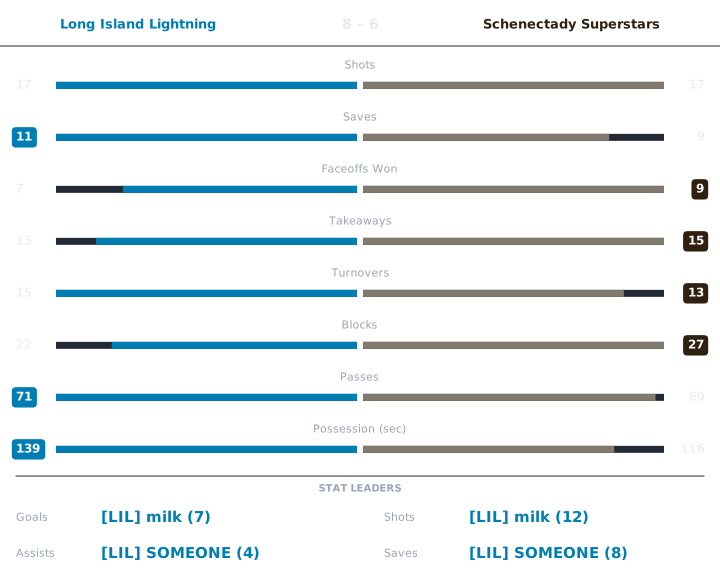
Match box score chart

APR is the Alto Performance Rating: 0 to 10, with 6.0 league average. Click any APR to see the working.

Long Island Lightning

PlayerGAPtsShotsSavesFOWFOLTKTOBlkPassesGWGPossAPRPucker+OffDef
[LIL] Jagr12322334262200:12727.385.57
[LIL] SOMEONE044383244111501:211136.087.63
[LIL] milk718121145953410:461146.275.41

Schenectady Superstars

PlayerGAPtsShotsSavesFOWFOLTKTOBlkPassesGWGPossAPRPucker+OffDef
[BOAT] GoldenKnight33693426472300:361237.106.16
[MIA] Zesh213513356102700:22765.555.69
[VIP] TheTopElite134352243101900:58936.086.72

Jagr Long Island Lightning

rated once over the whole game. Baseline: the player's own division.

APR5.2
StatValueLeague avgStd devWeightzContribution
Goals12.391.990.23-0.7-0.161
Assists22.382.010.19-0.189-0.036
Shots25.793.330.09-1.137-0.102
Passes2222.747.610.08-0.098-0.008
Saves23.393.770.19-0.369-0.07
Blocks66.584.860.11-0.119-0.013
Takeaways44.393.160.11-0.125-0.014

6.0 + clip(Σ −0.404 × 2, −3 to 3) = 5.192, nothing hit the bonus or penalty thresholds → 5.2

Pucker+72
StatValueLeague rateRatioWeightContribution
Goal contribution34.4550.6730.320.216
Shots25.7880.3460.080.028
Saves23.3940.5890.150.088
Blocks66.5760.9120.070.064
Takeaways44.3940.910.120.109
Passes2222.7420.9670.080.077
Faceoff win rate0.50.510.030.03

Σ 0.612 ÷ Σ weights 0.85 = 0.72 → ×100 = 72.01 → 72

Offensive7.38
RateValueLeagueWeightContribution
Points per possession-sec0.250.1040.43.821
Shooting %0.50.4140.21.365
Assists per pass0.0910.1050.42.192

Σ contribution = 7.377

Defensive5.57
StatValueLeague rated(ratio)WeightContribution
Saves23.3944.4440.31.333
Blocks66.5765.6510.21.13
Takeaways44.3945.6420.251.411
Goals conceded67.1826.7780.251.694

Σ contribution = 5.568

League average is 6.0 on APR, Offensive and Defensive, and 100 on Pucker+. Every formula.

SOMEONE Long Island Lightning

rated once over the whole game. Baseline: the player's own division.

APR6.2
StatValueLeague avgStd devWeightzContribution
Goals02.391.990.23-1.202-0.276
Assists42.382.010.190.8080.154
Shots35.793.330.09-0.837-0.075
Passes1522.747.610.08-1.017-0.081
Saves83.393.770.191.220.232
Blocks116.584.860.110.9110.1
Takeaways44.393.160.11-0.125-0.014

6.0 + clip(Σ 0.039 × 2, −3 to 3) = 6.078, then +0.35 saves, −0.2 cold shooting → 6.2

Pucker+113
StatValueLeague rateRatioWeightContribution
Goal contribution3.54.4550.7860.320.251
Shots35.7880.5180.080.041
Saves83.3942.3570.150.354
Blocks116.5761.6730.070.117
Takeaways44.3940.910.120.109
Passes1522.7420.660.080.053
Faceoff win rate0.60.51.20.030.036

Σ 0.962 ÷ Σ weights 0.85 = 1.131 → ×100 = 113.13 → 113

Offensive6.08
RateValueLeagueWeightContribution
Points per possession-sec0.0490.1040.41.631
Shooting %00.4140.20.591
Assists per pass0.2670.1050.43.862

Σ contribution = 6.084

Defensive7.63
StatValueLeague rated(ratio)WeightContribution
Saves83.3949.5030.32.851
Blocks116.5768.3470.21.669
Takeaways44.3945.6420.251.411
Goals conceded67.1826.7780.251.694

Σ contribution = 7.625

League average is 6.0 on APR, Offensive and Defensive, and 100 on Pucker+. Every formula.

milk Long Island Lightning

rated once over the whole game. Baseline: the player's own division.

APR7.3
StatValueLeague avgStd devWeightzContribution
Goals72.391.990.232.3130.532
Assists12.382.010.19-0.687-0.131
Shots125.793.330.091.8650.168
Passes3422.747.610.081.4790.118
Saves13.393.770.19-0.634-0.121
Blocks56.584.860.11-0.325-0.036
Takeaways54.393.160.110.1920.021

6.0 + clip(Σ 0.552 × 2, −3 to 3) = 7.105, then +0.5 hat trick, −0.3 turnovers → 7.3

Pucker+114
StatValueLeague rateRatioWeightContribution
Goal contribution84.4551.7960.320.575
Shots125.7882.0730.080.166
Saves13.3940.2950.150.044
Blocks56.5760.760.070.053
Takeaways54.3941.1380.120.137
Passes3422.7421.4950.080.12
Faceoff win rate0.20.50.40.030.012

Σ 1.106 ÷ Σ weights 0.85 = 1.301 − 0.157 turnover penalty = 1.144 → ×100 = 114.41 → 114

Offensive6.27
RateValueLeagueWeightContribution
Points per possession-sec0.1740.1040.43.344
Shooting %0.5830.4140.21.511
Assists per pass0.0290.1050.41.414

Σ contribution = 6.269

Defensive5.41
StatValueLeague rated(ratio)WeightContribution
Saves13.3943.5690.31.071
Blocks56.5765.0590.21.012
Takeaways54.3946.5480.251.637
Goals conceded67.1826.7780.251.694

Σ contribution = 5.414

League average is 6.0 on APR, Offensive and Defensive, and 100 on Pucker+. Every formula.

GoldenKnight Schenectady Superstars

rated once over the whole game. Baseline: the player's own division.

APR6.1
StatValueLeague avgStd devWeightzContribution
Goals32.391.990.230.3040.07
Assists32.382.010.190.310.059
Shots95.793.330.090.9640.087
Passes2322.747.610.080.0340.003
Saves33.393.770.19-0.104-0.02
Blocks76.584.860.110.0870.01
Takeaways64.393.160.110.5090.056

6.0 + clip(Σ 0.264 × 2, −3 to 3) = 6.528, then −0.2 cold shooting, −0.2 goals against → 6.1

Pucker+123
StatValueLeague rateRatioWeightContribution
Goal contribution64.4551.3470.320.431
Shots95.7881.5550.080.124
Saves33.3940.8840.150.133
Blocks76.5761.0650.070.075
Takeaways64.3941.3660.120.164
Passes2322.7421.0110.080.081
Faceoff win rate0.6670.51.3330.030.04

Σ 1.047 ÷ Σ weights 0.85 = 1.232 → ×100 = 123.21 → 123

Offensive7.10
RateValueLeagueWeightContribution
Points per possession-sec0.1670.1040.43.268
Shooting %0.3330.4140.21.047
Assists per pass0.130.1050.42.787

Σ contribution = 7.102

Defensive6.16
StatValueLeague rated(ratio)WeightContribution
Saves33.3945.5380.31.661
Blocks76.5766.2580.21.252
Takeaways64.3947.40.251.85
Goals conceded87.1825.5920.251.398

Σ contribution = 6.161

League average is 6.0 on APR, Offensive and Defensive, and 100 on Pucker+. Every formula.

Zesh Schenectady Superstars

rated once over the whole game. Baseline: the player's own division.

APR5.0
StatValueLeague avgStd devWeightzContribution
Goals22.391.990.23-0.198-0.045
Assists12.382.010.19-0.687-0.131
Shots55.793.330.09-0.237-0.021
Passes2722.747.610.080.5590.045
Saves13.393.770.19-0.634-0.121
Blocks106.584.860.110.7050.078
Takeaways54.393.160.110.1920.021

6.0 + clip(Σ −0.174 × 2, −3 to 3) = 5.651, then −0.3 turnovers, −0.2 cold shooting, −0.2 goals against → 5.0

Pucker+76
StatValueLeague rateRatioWeightContribution
Goal contribution34.4550.6730.320.216
Shots55.7880.8640.080.069
Saves13.3940.2950.150.044
Blocks106.5761.5210.070.106
Takeaways54.3941.1380.120.137
Passes2722.7421.1870.080.095
Faceoff win rate0.50.510.030.03

Σ 0.697 ÷ Σ weights 0.85 = 0.82 − 0.055 turnover penalty = 0.765 → ×100 = 76.49 → 76

Offensive5.55
RateValueLeagueWeightContribution
Points per possession-sec0.1360.1040.42.889
Shooting %0.40.4140.21.174
Assists per pass0.0370.1050.41.49

Σ contribution = 5.552

Defensive5.69
StatValueLeague rated(ratio)WeightContribution
Saves13.3943.5690.31.071
Blocks106.5767.9130.21.583
Takeaways54.3946.5480.251.637
Goals conceded87.1825.5920.251.398

Σ contribution = 5.689

League average is 6.0 on APR, Offensive and Defensive, and 100 on Pucker+. Every formula.

TheTopElite Schenectady Superstars

rated once over the whole game. Baseline: the player's own division.

APR5.5
StatValueLeague avgStd devWeightzContribution
Goals12.391.990.23-0.7-0.161
Assists32.382.010.190.310.059
Shots35.793.330.09-0.837-0.075
Passes1922.747.610.08-0.492-0.039
Saves53.393.770.190.4260.081
Blocks106.584.860.110.7050.078
Takeaways44.393.160.11-0.125-0.014

6.0 + clip(Σ −0.072 × 2, −3 to 3) = 5.856, then −0.2 cold shooting, −0.2 goals against → 5.5

Pucker+93
StatValueLeague rateRatioWeightContribution
Goal contribution34.4550.6730.320.216
Shots35.7880.5180.080.041
Saves53.3941.4730.150.221
Blocks106.5761.5210.070.106
Takeaways44.3940.910.120.109
Passes1922.7420.8350.080.067
Faceoff win rate0.50.510.030.03

Σ 0.79 ÷ Σ weights 0.85 = 0.93 → ×100 = 93 → 93

Offensive6.08
RateValueLeagueWeightContribution
Points per possession-sec0.0690.1040.41.884
Shooting %0.3330.4140.21.047
Assists per pass0.1580.1050.43.151

Σ contribution = 6.082

Defensive6.72
StatValueLeague rated(ratio)WeightContribution
Saves53.3947.7630.32.329
Blocks106.5767.9130.21.583
Takeaways44.3945.6420.251.411
Goals conceded87.1825.5920.251.398

Σ contribution = 6.721

League average is 6.0 on APR, Offensive and Defensive, and 100 on Pucker+. Every formula.