OCHomeOregon Capybaras - west
12–4Final
SSAwaySacramento Steamers

Feb 20, 2024 · Masters Division · Moda Center

MVP [OCA] Carried by Dad · 8.1 performance rating

Writing the recap…

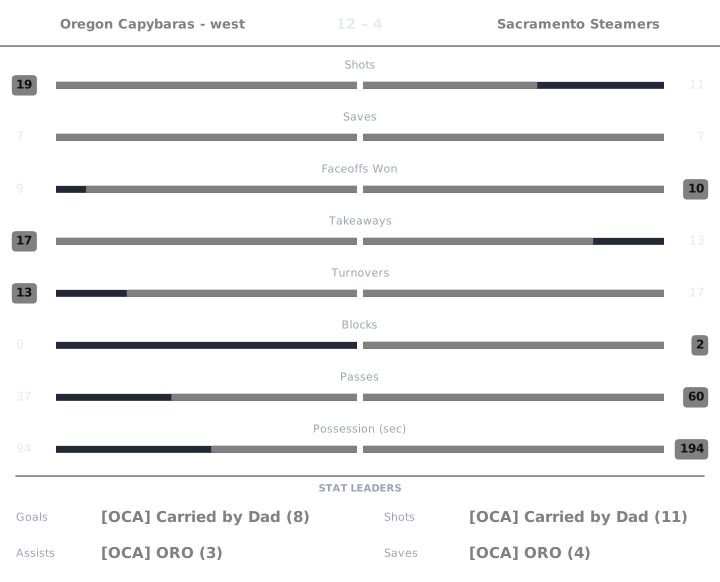
Match box score chart

Perf is a 0 to 10 Alto rating, 6.0 being league average. Click any Perf number to see the working behind it.

Oregon Capybaras - west

PlayerGAPtsShotsSavesFOWFOLTKTOBlkPassesGWGPossPerfPucker+OffDef
[OCA] Carried by Dad8210110338701200:351619.075.57
[OCA] Curt32563424301500:151128.356.18
[OCA] ORO13424255301000:441047.846.78

Sacramento Steamers

PlayerGAPtsShotsSavesFOWFOLTKTOBlkPassesGWGPossPerfPucker+OffDef
[SDS] Mojo20254246722201:431143.637.43
[SDS] kale11251642601600:38564.593.83
[SSS] Headass13412215402200:53947.324.93

Carried by Dad Oregon Capybaras - west

rated once over the whole game. Baseline: the player's own division.

Performance8.1
StatValueLeague avgStd devWeightzContribution
Goals81.971.720.233.5020.806
Assists21.651.470.190.2380.045
Shots114.12.930.092.3520.212
Passes1218.397.150.08-0.894-0.072
Saves02.142.230.19-0.959-0.182
Blocks00.710.11-0.695-0.076
Takeaways84.663.240.111.0320.114

6.0 + clip(Σ 0.846 × 2, −3 to 3) = 7.691, then +0.5 hat trick, +0.25 hot shooting, −0.3 turnovers → 8.1

Pucker+161
StatValueLeague rateRatioWeightContribution
Goal contribution103.4292.9160.320.933
Shots114.1032.6810.080.214
Saves02.13500.150
Blocks00.69700.070
Takeaways84.6581.7170.120.206
Passes1218.3940.6520.080.052
Faceoff win rate0.50.510.030.03

Σ 1.436 ÷ Σ weights 0.85 = 1.689 − 0.076 turnover penalty = 1.613 → ×100 = 161.3 → 161

Offensive9.07
RateValueLeagueWeightContribution
Points per possession-sec0.2860.0790.43.982
Shooting %0.7270.480.21.58
Assists per pass0.1670.090.43.511

Σ contribution = 9.073

Defensive5.57
StatValueLeague rated(ratio)WeightContribution
Saves02.1352.9540.30.886
Blocks00.6972.9540.20.591
Takeaways84.6588.4610.252.115
Goals conceded46.0587.8940.251.973

Σ contribution = 5.565

League average is 6.0 on Performance, Offensive and Defensive, and 100 on Pucker+. Every formula.

Curt Oregon Capybaras - west

rated once over the whole game. Baseline: the player's own division.

Performance6.4
StatValueLeague avgStd devWeightzContribution
Goals31.971.720.230.5990.138
Assists21.651.470.190.2380.045
Shots64.12.930.090.6470.058
Passes1518.397.150.08-0.474-0.038
Saves32.142.230.190.3880.074
Blocks00.710.11-0.695-0.076
Takeaways44.663.240.11-0.203-0.022

6.0 + clip(Σ 0.178 × 2, −3 to 3) = 6.356, nothing hit the bonus or penalty thresholds → 6.4

Pucker+112
StatValueLeague rateRatioWeightContribution
Goal contribution4.53.4291.3120.320.42
Shots64.1031.4620.080.117
Saves32.1351.4050.150.211
Blocks00.69700.070
Takeaways44.6580.8590.120.103
Passes1518.3940.8160.080.065
Faceoff win rate0.6670.51.3330.030.04

Σ 0.956 ÷ Σ weights 0.85 = 1.125 → ×100 = 112.46 → 112

Offensive8.35
RateValueLeagueWeightContribution
Points per possession-sec0.3330.0790.43.995
Shooting %0.50.480.21.234
Assists per pass0.1330.090.43.12

Σ contribution = 8.349

Defensive6.18
StatValueLeague rated(ratio)WeightContribution
Saves32.1357.5360.32.261
Blocks00.6972.9540.20.591
Takeaways44.6585.4390.251.36
Goals conceded46.0587.8940.251.973

Σ contribution = 6.185

League average is 6.0 on Performance, Offensive and Defensive, and 100 on Pucker+. Every formula.

ORO Oregon Capybaras - west

rated once over the whole game. Baseline: the player's own division.

Performance6.0
StatValueLeague avgStd devWeightzContribution
Goals11.971.720.23-0.562-0.129
Assists31.651.470.190.9190.175
Shots24.12.930.09-0.717-0.065
Passes1018.397.150.08-1.174-0.094
Saves42.142.230.190.8370.159
Blocks00.710.11-0.695-0.076
Takeaways54.663.240.110.1060.012

6.0 + clip(Σ −0.019 × 2, −3 to 3) = 5.962, nothing hit the bonus or penalty thresholds → 6.0

Pucker+104
StatValueLeague rateRatioWeightContribution
Goal contribution43.4291.1670.320.373
Shots24.1030.4870.080.039
Saves42.1351.8730.150.281
Blocks00.69700.070
Takeaways54.6581.0730.120.129
Passes1018.3940.5440.080.043
Faceoff win rate0.2860.50.5710.030.017

Σ 0.883 ÷ Σ weights 0.85 = 1.038 → ×100 = 103.85 → 104

Offensive7.84
RateValueLeagueWeightContribution
Points per possession-sec0.0910.0790.42.631
Shooting %0.50.480.21.234
Assists per pass0.30.090.43.971

Σ contribution = 7.835

Defensive6.78
StatValueLeague rated(ratio)WeightContribution
Saves42.1358.8120.32.644
Blocks00.6972.9540.20.591
Takeaways54.6586.2930.251.573
Goals conceded46.0587.8940.251.973

Σ contribution = 6.781

League average is 6.0 on Performance, Offensive and Defensive, and 100 on Pucker+. Every formula.

Mojo Sacramento Steamers

rated once over the whole game. Baseline: the player's own division.

Performance5.7
StatValueLeague avgStd devWeightzContribution
Goals21.971.720.230.0190.004
Assists01.651.470.19-1.126-0.214
Shots54.12.930.090.3060.028
Passes2218.397.150.080.5040.04
Saves42.142.230.190.8370.159
Blocks20.710.111.30.143
Takeaways64.663.240.110.4140.046

6.0 + clip(Σ 0.206 × 2, −3 to 3) = 6.412, then −0.3 turnovers, −0.2 cold shooting, −0.2 goals against → 5.7

Pucker+114
StatValueLeague rateRatioWeightContribution
Goal contribution23.4290.5830.320.187
Shots54.1031.2190.080.097
Saves42.1351.8730.150.281
Blocks20.6972.870.070.201
Takeaways64.6581.2880.120.155
Passes2218.3941.1960.080.096
Faceoff win rate0.3330.50.6670.030.02

Σ 1.036 ÷ Σ weights 0.85 = 1.219 − 0.076 turnover penalty = 1.143 → ×100 = 114.28 → 114

Offensive3.63
RateValueLeagueWeightContribution
Points per possession-sec0.0190.0790.41.379
Shooting %0.40.480.21.069
Assists per pass00.090.41.181

Σ contribution = 3.629

Defensive7.43
StatValueLeague rated(ratio)WeightContribution
Saves42.1358.8120.32.644
Blocks20.6979.8150.21.963
Takeaways64.6587.1210.251.78
Goals conceded126.0584.1670.251.042

Σ contribution = 7.429

League average is 6.0 on Performance, Offensive and Defensive, and 100 on Pucker+. Every formula.

kale Sacramento Steamers

rated once over the whole game. Baseline: the player's own division.

Performance4.3
StatValueLeague avgStd devWeightzContribution
Goals11.971.720.23-0.562-0.129
Assists11.651.470.19-0.444-0.084
Shots54.12.930.090.3060.028
Passes1618.397.150.08-0.335-0.027
Saves12.142.230.19-0.51-0.097
Blocks00.710.11-0.695-0.076
Takeaways24.663.240.11-0.821-0.09

6.0 + clip(Σ −0.477 × 2, −3 to 3) = 5.047, then −0.3 turnovers, −0.2 cold shooting, −0.2 goals against → 4.3

Pucker+56
StatValueLeague rateRatioWeightContribution
Goal contribution23.4290.5830.320.187
Shots54.1031.2190.080.097
Saves12.1350.4680.150.07
Blocks00.69700.070
Takeaways24.6580.4290.120.052
Passes1618.3940.870.080.07
Faceoff win rate0.60.51.20.030.036

Σ 0.511 ÷ Σ weights 0.85 = 0.602 − 0.044 turnover penalty = 0.558 → ×100 = 55.77 → 56

Offensive4.59
RateValueLeagueWeightContribution
Points per possession-sec0.0530.0790.41.88
Shooting %0.20.480.20.78
Assists per pass0.0620.090.41.928

Σ contribution = 4.589

Defensive3.83
StatValueLeague rated(ratio)WeightContribution
Saves12.1354.0530.31.216
Blocks00.6972.9540.20.591
Takeaways24.6583.9370.250.984
Goals conceded126.0584.1670.251.042

Σ contribution = 3.833

League average is 6.0 on Performance, Offensive and Defensive, and 100 on Pucker+. Every formula.

Headass Sacramento Steamers

rated once over the whole game. Baseline: the player's own division.

Performance5.9
StatValueLeague avgStd devWeightzContribution
Goals11.971.720.23-0.562-0.129
Assists31.651.470.190.9190.175
Shots14.12.930.09-1.058-0.095
Passes2218.397.150.080.5040.04
Saves22.142.230.19-0.061-0.012
Blocks00.710.11-0.695-0.076
Takeaways54.663.240.110.1060.012

6.0 + clip(Σ −0.086 × 2, −3 to 3) = 5.828, then +0.25 hot shooting, −0.2 goals against → 5.9

Pucker+94
StatValueLeague rateRatioWeightContribution
Goal contribution43.4291.1670.320.373
Shots14.1030.2440.080.019
Saves22.1350.9370.150.14
Blocks00.69700.070
Takeaways54.6581.0730.120.129
Passes2218.3941.1960.080.096
Faceoff win rate0.6670.51.3330.030.04

Σ 0.798 ÷ Σ weights 0.85 = 0.939 → ×100 = 93.85 → 94

Offensive7.32
RateValueLeagueWeightContribution
Points per possession-sec0.0750.0790.42.321
Shooting %10.480.21.836
Assists per pass0.1360.090.43.163

Σ contribution = 7.32

Defensive4.93
StatValueLeague rated(ratio)WeightContribution
Saves22.1355.7470.31.724
Blocks00.6972.9540.20.591
Takeaways54.6586.2930.251.573
Goals conceded126.0584.1670.251.042

Σ contribution = 4.93

League average is 6.0 on Performance, Offensive and Defensive, and 100 on Pucker+. Every formula.