DFHomeDunham Flame
3–4Final
Away · SEASeattle Cyclones

Sep 3, 2023 · Open Division - Playoffs · Topper arena

MVP [BB] WillTheQc(Kick/TTV) · 6.4 performance rating

Writing the recap…

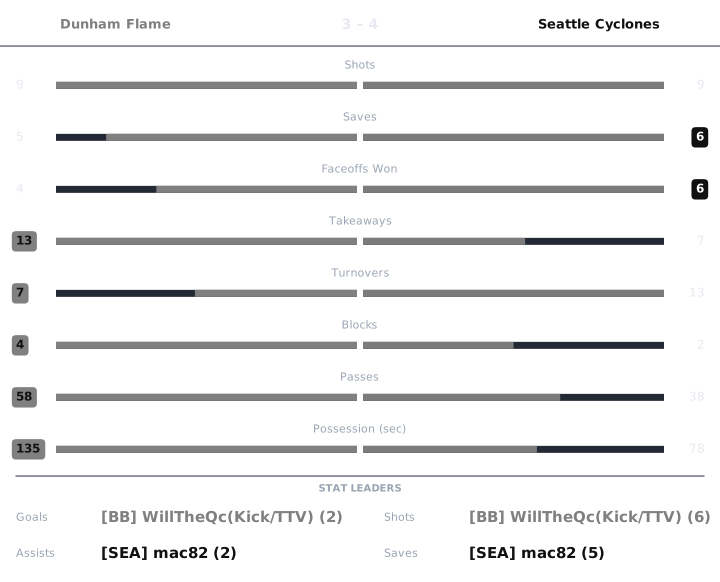
Match box score chart

Perf is a 0 to 10 Alto rating, 6.0 being league average. Click any Perf number to see the working behind it.

Dunham Flame

PlayerGAPtsShotsSavesFOWFOLTKTOBlkPassesGWGPossPerfPucker+OffDef
[BB] WillTheQc(Kick/TTV)21361327212700:371284.557.22
[DUN] Pierrot_reins/ttv00021131202200:17342.954.75
[HCAT] papi tef1011301533901:211074.288.48

Seattle Cyclones

PlayerGAPtsShotsSavesFOWFOLTKTOBlkPassesGWGPossPerfPucker+OffDef
[SEA] DillyWooWho11210012201300:17446.555.00
[SEA] mac8212355423311100:561266.038.33
[SEA] wads21331212811410:05567.526.32

WillTheQc(Kick/TTV) Dunham Flame

rated once over the whole game. Baseline: the player's own division.

Performance6.4
StatValueLeague avgStd devWeightzContribution
Goals21.951.780.230.0270.006
Assists11.41.260.19-0.32-0.061
Shots64.052.970.090.6570.059
Passes2714.986.330.081.8990.152
Saves12.12.270.19-0.484-0.092
Blocks10.660.880.110.3890.043
Takeaways72.662.390.111.8170.2

6.0 + clip(Σ 0.307 × 2, −3 to 3) = 6.615, then −0.2 cold shooting → 6.4

Pucker+128
StatValueLeague rateRatioWeightContribution
Goal contribution33.2930.9110.320.292
Shots64.0491.4820.080.119
Saves12.0980.4770.150.072
Blocks10.6591.5190.070.106
Takeaways72.6592.6330.120.316
Passes2714.9761.8030.080.144
Faceoff win rate0.60.51.20.030.036

Σ 1.084 ÷ Σ weights 0.85 = 1.275 → ×100 = 127.54 → 128

Offensive4.55
RateValueLeagueWeightContribution
Points per possession-sec0.0810.1040.42.05
Shooting %0.3330.4820.20.961
Assists per pass0.0370.0940.41.536

Σ contribution = 4.546

Defensive7.22
StatValueLeague rated(ratio)WeightContribution
Saves12.0984.0790.31.224
Blocks10.6597.9060.21.581
Takeaways72.6599.7060.252.426
Goals conceded46.1347.9520.251.988

Σ contribution = 7.219

League average is 6.0 on Performance, Offensive and Defensive, and 100 on Pucker+. Every formula.

Pierrot_reins/ttv Dunham Flame

rated once over the whole game. Baseline: the player's own division.

Performance4.4
StatValueLeague avgStd devWeightzContribution
Goals01.951.780.23-1.094-0.252
Assists01.41.260.19-1.117-0.212
Shots24.052.970.09-0.69-0.062
Passes2214.986.330.081.110.089
Saves12.12.270.19-0.484-0.092
Blocks00.660.880.11-0.75-0.083
Takeaways12.662.390.11-0.694-0.076

6.0 + clip(Σ −0.688 × 2, −3 to 3) = 4.624, then −0.2 cold shooting → 4.4

Pucker+34
StatValueLeague rateRatioWeightContribution
Goal contribution03.29300.320
Shots24.0490.4940.080.04
Saves12.0980.4770.150.072
Blocks00.65900.070
Takeaways12.6590.3760.120.045
Passes2214.9761.4690.080.118
Faceoff win rate0.250.50.50.030.015

Σ 0.289 ÷ Σ weights 0.85 = 0.34 → ×100 = 33.96 → 34

Offensive2.95
RateValueLeagueWeightContribution
Points per possession-sec00.1040.41.181
Shooting %00.4820.20.591
Assists per pass00.0940.41.181

Σ contribution = 2.954

Defensive4.75
StatValueLeague rated(ratio)WeightContribution
Saves12.0984.0790.31.224
Blocks00.6592.9540.20.591
Takeaways12.6593.7850.250.946
Goals conceded46.1347.9520.251.988

Σ contribution = 4.749

League average is 6.0 on Performance, Offensive and Defensive, and 100 on Pucker+. Every formula.

papi tef Dunham Flame

rated once over the whole game. Baseline: the player's own division.

Performance6.2
StatValueLeague avgStd devWeightzContribution
Goals11.951.780.23-0.533-0.123
Assists01.41.260.19-1.117-0.212
Shots14.052.970.09-1.027-0.092
Passes914.986.330.08-0.944-0.076
Saves32.12.270.190.3980.076
Blocks30.660.880.112.6670.293
Takeaways52.662.390.110.980.108

6.0 + clip(Σ −0.026 × 2, −3 to 3) = 5.948, then +0.25 hot shooting → 6.2

Pucker+107
StatValueLeague rateRatioWeightContribution
Goal contribution13.2930.3040.320.097
Shots14.0490.2470.080.02
Saves32.0981.430.150.215
Blocks30.6594.5560.070.319
Takeaways52.6591.8810.120.226
Passes914.9760.6010.080.048
Faceoff win rate00.500.030

Σ 0.924 ÷ Σ weights 0.85 = 1.087 − 0.02 turnover penalty = 1.067 → ×100 = 106.72 → 107

Offensive4.28
RateValueLeagueWeightContribution
Points per possession-sec0.0120.1040.41.268
Shooting %10.4820.21.833
Assists per pass00.0940.41.181

Σ contribution = 4.283

Defensive8.48
StatValueLeague rated(ratio)WeightContribution
Saves32.0987.6220.32.287
Blocks30.6599.9930.21.999
Takeaways52.6598.8270.252.207
Goals conceded46.1347.9520.251.988

Σ contribution = 8.481

League average is 6.0 on Performance, Offensive and Defensive, and 100 on Pucker+. Every formula.

DillyWooWho Seattle Cyclones

rated once over the whole game. Baseline: the player's own division.

Performance5.1
StatValueLeague avgStd devWeightzContribution
Goals11.951.780.23-0.533-0.123
Assists11.41.260.19-0.32-0.061
Shots14.052.970.09-1.027-0.092
Passes1314.986.330.08-0.312-0.025
Saves02.12.270.19-0.924-0.176
Blocks00.660.880.11-0.75-0.083
Takeaways22.662.390.11-0.276-0.03

6.0 + clip(Σ −0.589 × 2, −3 to 3) = 4.821, then +0.25 hot shooting → 5.1

Pucker+44
StatValueLeague rateRatioWeightContribution
Goal contribution23.2930.6070.320.194
Shots14.0490.2470.080.02
Saves02.09800.150
Blocks00.65900.070
Takeaways22.6590.7520.120.09
Passes1314.9760.8680.080.069
Faceoff win rate00.500.030

Σ 0.374 ÷ Σ weights 0.85 = 0.44 → ×100 = 43.98 → 44

Offensive6.55
RateValueLeagueWeightContribution
Points per possession-sec0.1180.1040.42.604
Shooting %10.4820.21.833
Assists per pass0.0770.0940.42.117

Σ contribution = 6.554

Defensive5.00
StatValueLeague rated(ratio)WeightContribution
Saves02.0982.9540.30.886
Blocks00.6592.9540.20.591
Takeaways22.6595.0290.251.257
Goals conceded36.1349.0460.252.262

Σ contribution = 4.996

League average is 6.0 on Performance, Offensive and Defensive, and 100 on Pucker+. Every formula.

mac82 Seattle Cyclones

rated once over the whole game. Baseline: the player's own division.

Performance6.3
StatValueLeague avgStd devWeightzContribution
Goals11.951.780.23-0.533-0.123
Assists21.41.260.190.4760.09
Shots54.052.970.090.320.029
Passes1114.986.330.08-0.628-0.05
Saves52.12.270.191.2790.243
Blocks10.660.880.110.3890.043
Takeaways32.662.390.110.1430.016

6.0 + clip(Σ 0.248 × 2, −3 to 3) = 6.496, then −0.2 cold shooting → 6.3

Pucker+126
StatValueLeague rateRatioWeightContribution
Goal contribution33.2930.9110.320.292
Shots54.0491.2350.080.099
Saves52.0982.3840.150.358
Blocks10.6591.5190.070.106
Takeaways32.6591.1280.120.135
Passes1114.9760.7350.080.059
Faceoff win rate0.6670.51.3330.030.04

Σ 1.088 ÷ Σ weights 0.85 = 1.28 − 0.02 turnover penalty = 1.26 → ×100 = 126.04 → 126

Offensive6.03
RateValueLeagueWeightContribution
Points per possession-sec0.0540.1040.41.678
Shooting %0.20.4820.20.779
Assists per pass0.1820.0940.43.578

Σ contribution = 6.034

Defensive8.33
StatValueLeague rated(ratio)WeightContribution
Saves52.0989.5270.32.858
Blocks10.6597.9060.21.581
Takeaways32.6596.5110.251.628
Goals conceded36.1349.0460.252.262

Σ contribution = 8.329

League average is 6.0 on Performance, Offensive and Defensive, and 100 on Pucker+. Every formula.

wads Seattle Cyclones

rated once over the whole game. Baseline: the player's own division.

Performance5.6
StatValueLeague avgStd devWeightzContribution
Goals21.951.780.230.0270.006
Assists11.41.260.19-0.32-0.061
Shots34.052.970.09-0.353-0.032
Passes1414.986.330.08-0.154-0.012
Saves12.12.270.19-0.484-0.092
Blocks10.660.880.110.3890.043
Takeaways22.662.390.11-0.276-0.03

6.0 + clip(Σ −0.178 × 2, −3 to 3) = 5.644, then +0.25 hot shooting, −0.3 turnovers → 5.6

Pucker+56
StatValueLeague rateRatioWeightContribution
Goal contribution33.2930.9110.320.292
Shots34.0490.7410.080.059
Saves12.0980.4770.150.072
Blocks10.6591.5190.070.106
Takeaways22.6590.7520.120.09
Passes1414.9760.9350.080.075
Faceoff win rate0.6670.51.3330.030.04

Σ 0.734 ÷ Σ weights 0.85 = 0.863 − 0.303 turnover penalty = 0.56 → ×100 = 55.97 → 56

Offensive7.52
RateValueLeagueWeightContribution
Points per possession-sec0.60.1040.44
Shooting %0.6670.4820.21.492
Assists per pass0.0710.0940.42.027

Σ contribution = 7.52

Defensive6.32
StatValueLeague rated(ratio)WeightContribution
Saves12.0984.0790.31.224
Blocks10.6597.9060.21.581
Takeaways22.6595.0290.251.257
Goals conceded36.1349.0460.252.262

Σ contribution = 6.324

League average is 6.0 on Performance, Offensive and Defensive, and 100 on Pucker+. Every formula.